0

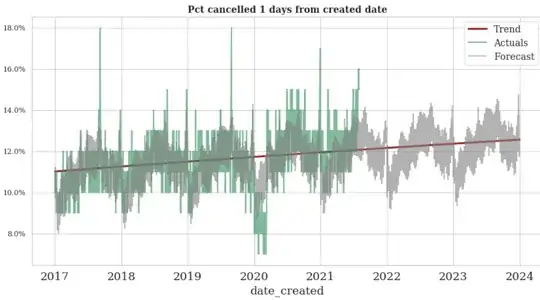
My current struggle is to forecast the distribution of a given value across the next 360 days. e.g. The context is hotel accomodation bookings. We have a forecast of 100 bookings to be made for time t . What I need to forecast is when will these bookings checkin (in the next 360 days) , i.e. distributing the 100 bookings such that x% checkin +0 days from created date , y% checkin +1 day from created day and so on upto 360 days. The percentages seem quite stable and forecastable (with some seasonality) - see figure below. enter image description here
In forecasting these percentages I have to deal with the following constraints :

  1. The sum of these percentages should add up to 100% (i.e if i distribute 100 bookings over 360 days - that distribution should of course add up to 100%) Since I am forecasting each of these series separately , is there a smart way to do this in python without having to distirbute the spillover
  2. I am using Prophet to forecast these percentages , just to ensure I can put an upper cap to my percentages forecasted. The R squared values are quite poor . Are there any suggestions for a better modeling methodology I can use?

The title below should read Pct checkin 1 day from created date (instead of *Pct cancelled) enter image description here
  • 1
    Why would you need daily forecast for 360 days? I would expect the noise to signal ratio to high for low frequency and longer duration forecast. – forecaster Aug 27 '21 at 11:47
  • You could have a look at [hierarchical forecasting](https://stats.stackexchange.com/questions/240863/choice-of-time-series-model-for-store-sales-prediction/339038#339038) – kjetil b halvorsen Aug 27 '21 at 14:56
  • @kjetilbhalvorsen : yes hierarchical forecast seems like a good candidate. Will look up some python packages for this. Thanks for the suggestion – Roopanjali Jasrotia Aug 27 '21 at 17:59
  • @forecaster : There is a business need to provide forecast for 18 month horizon - which is revised every 2 months – Roopanjali Jasrotia Aug 27 '21 at 18:00
  • Instead of having percentages on the y axes or as a target variable, you should have the days to checking on the y axis/as the (scalar) target variable, and there you can try to predict individual centiles/quantiles of the distribution so that you know what percentage of people will do it before 1 day, 2 days 3 days ..., Another option is to try model the shape of that distribution directly and obtain the quantiles from the forecasted PDF/PMF. Buzzwords you are looking for are distributional, quantile, and probabilistic forecasting – rep_ho Aug 27 '21 at 23:37
  • @rep_ho This is interesting . In your second option do you suggest modeling the shape of the distribution of the book window (aka days to checkin) ? I am inclined towards using that since I can then directly obtain the desired quantiles from the distribution instead of having to predict them (in option 1). Not really sure how to go about predicting the quantiles in option 1, but I figure modeling the distribution would be easier (looking up density /distributional forecasting g etc. - Thanks again for the keyword guidance - all new to me ) – Roopanjali Jasrotia Aug 30 '21 at 06:41
  • @rep_ho hello I have a follow up question, and I am posting a new on here . Would be great to hear your thoughts https://stats.stackexchange.com/questions/542065/driver-based-forecasting-using-past-distributions – Roopanjali Jasrotia Aug 31 '21 at 16:15

0 Answers0