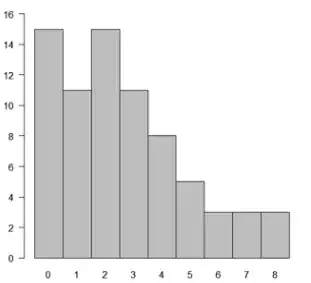
Looking at this distribution, I originally believed this to be a positively skewed histogram, but on reanalysis, I'm now stuck between if it's a positive skewed histogram or a multimodal histogram, as of the two peaks being the same number.
-
Duplicate https://stats.stackexchange.com/questions/138223/how-to-test-if-my-distribution-is-multimodal – msuzen Aug 25 '21 at 00:00
1 Answers
By definition it 'is' bimodal as it has two modes. However, it is made from a small number of values (observations?) and so it is very likely that the details of the histogram differ quite a bit from the details of the underlying population distribution. My guess is that the population distribution is right skewed but not bimodal, but you have not told us anything about what the values represent and sometimes there is relevant information outside of the observed sample.
It is important to know that the difference between the modal frequency of 15 and the inter-modal value of 11 is trivially small, assuming that the values are random observations. Simulations using pseudo-data are very helpful in tuning your intuition regarding distributions.
- 10,995
- 2
- 29
- 47
