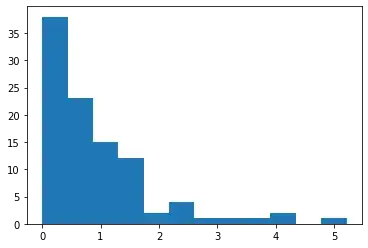
I'm a little confused how the CLT can apply to aggregations of the exponential distribution. It's my understanding that the CLT says, in plain English, "sample means from virtually any distribution will tend towards normal." I've seen this demonstrated in the case of rolling a fair, 6-sided die. If single rolls are sampled then the distribution will remain uniform. However, if 2+ rolls were executed per trial, then the resulting distribution will be approximately normal, peaking at 3.5 when n is sufficiently high.
However, I'm trying to replicate this process with the exponential distribution and not finding the result I was expecting.
import numpy as np
import matplotlib.pyplot as plt

samples = []
sample_size = 2
itrs = 10_000
while len(samples) < itrs:
  samples.append(sum(np.random.exponential(scale=1,size=sample_size))/sample_size)

plt.hist(dist,bins=12)
So either my understanding of the CLT is far off or the numpy's exponential sampler doesn't behave the way that I had expected. Could someone clarify where I'm going wrong?
