3

I used 3 continuous predictors (standardized to unit scale with mean = 0) in a glm model to solve for a two-class categorical problem (case, control). The model was selected in a previous published work, we just repeated the predictors measurements in the two new datasets below.

How can I explain the discrepancies between the predicted probabilities across these two datasets?

I was told that the first one is poor because it is close to 50% probability (i.e., random), even though it correctly classifies all samples. I'm not sure if we can make that claim by using the model's predictive proabibility...

Accuracy and 95% CI for:

  • dataset A: 100% (86.7 % - 100%)
  • dataset B: 100% (78.19% - 100%)

Any input is appreciated.
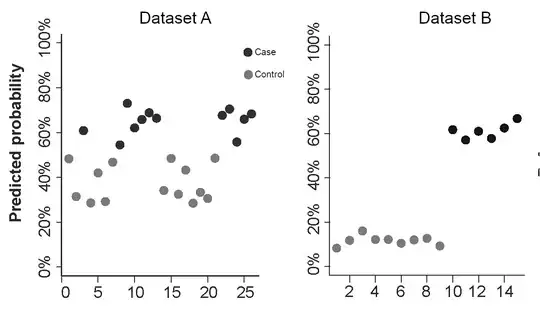
Continuous predictor was used as predictor for a two-class categorical variable. In both datasets, the predictor is on variance unit with mean zero.

BioLeal
  • 115
  • 7

1 Answers1

1

Which of those plots looks like the classes are easier to distinguish? I say the second. After all, in the first one, I could believe that a "case" subject could full below $50\%$, since that is not so far out of the mainstream of the predicted probabilities (ranging from about $55$ to $75$). On the right, it would be very surprising to find a "case" with a probability near the probabilities given for "control" subjects.

This relates to something called a (strictly) proper scoring rule. Statisticians tend to prefer such metrics over metrics like accuracy. While the "accuracy" (at a particular threshold...always remember that "accuracy" requires a threshold) is the same for both, the model does not really know what it is doing in the first case. In the $20-40$ range, every subject is a "control" instead of $20-40$ percent being "case".

Dave
  • 28,473
  • 4
  • 52
  • 104
  • I found out that the control samples in dataset A is more heterogenous compared to those in dataset B. Can this, at least in part, explain such differences? Thank you for those references by the way, very useful. – BioLeal Aug 17 '21 at 13:27
  • @BioLeal I do not follow what you mean about that. Could you please clarify? – Dave Aug 17 '21 at 13:29
  • I meant that the controls in dataset B all have similar age range, absence of comorbities etc., while the first group did not impose such constraints. Therefore the cases in dataset A are drawn from a more heterogenous population than in B. Curiously, the cases are all around 60% in both. – BioLeal Aug 17 '21 at 14:20
  • Nothing about that strikes me as a major cause of what you're seeing. – Dave Aug 17 '21 at 14:27
  • Ok, thanks. Do you have a suggestion of (strictly) proper scoring rule for this case? – BioLeal Aug 17 '21 at 15:27
  • Logistic regression works by minimizing [**log loss**](https://en.wikipedia.org/wiki/Cross_entropy#Cross-entropy_loss_function_and_logistic_regression). Another option is [**Brier score**](https://en.wikipedia.org/wiki/Brier_score). You will find both to give lower scores on dataset B. – Dave Aug 17 '21 at 15:31