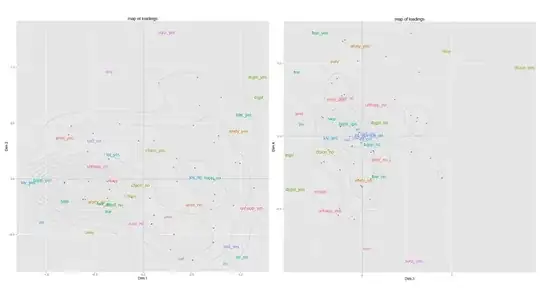
While there are numerous methods in exploring relation between x and y upon receiving a new dataset. Yet it seems I can't find any conclusive guide as of the sequence of analysis, e.g. do correlation first or after assessing normality. Any suggestions/experience sharing as of the sequences and the approach for such handling?
Second, it's an easy case when a variable x is plotted to be linearly correlated with the target y, what if there is no such linearity found from the plot? Some may say apply linear transformation to make linearity more apparent, but what to do when after transformation still nothing significant from the graph? Also, what should we do when the plot shows no relation at all? How to know what type of transformation or non-linear methods to apply to handle seemingly unrelated x and y to make them meaningful? Concern here is I'm afraid to let non-linear relation between x and y gone un-noticed.
All these questions apply to either the EDA for statistical or ML models. Thanks in advance!
update: Thanks to the comments, I've added an image here to illustrate what it means by 'the plot that shows no relation between x and y': (for the middle graph, only look at those circled in red)
