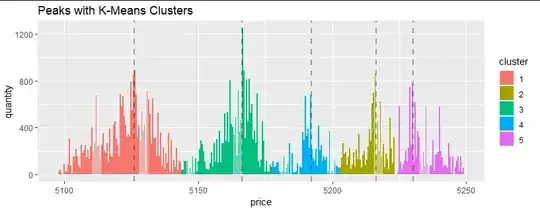
My dataset below shows product sales per price (link to download dataset csv):
     price      quantity
0    5098.0        20
1    5098.5        40
2    5099.0        10
3    5100.0        90
4    5100.5        20
..      ...       ...
290  5247.0       150
291  5247.5        30
292  5248.0       150
293  5248.5        20
294  5249.0        55

[295 rows x 2 columns]
The image below illustratre my question. I added the blue line using a KernelDensity (KernelDensity(kernel='gaussian', bandwidth=1.5).fit(price,sample_weight=quantity)) for illustrative purpose.

So what I'm trying to achieve:
- Cluster the dense regions, which are the red, green, dark blue and pink rectangles. This is the most importat thing to achieve in this question.
- Get the price boundaries of each region, where the probability is low (shown with the yellow arrows on the bottom part). The issue here is that each region will have different density.
- Get the peaks within each region (up arrows). The issue here is to detect 1-3 peaks of each region, not 1-3 peaks of the entire dataset (orange rectangle).
The algorithm that seems to better solve my problem is HDBSCAN, which has a hierarchical clustering approach and deals great with noise (present in my dataset):
import hdbscan
import plotly.express as px
import pandas as pd

data = pd.read_csv('data_set.csv')

clusterer = hdbscan.HDBSCAN(min_cluster_size=4,min_samples=8)
clusterer.fit(data)
data['cluster'] = clusterer.labels_

fig = px.bar(data,x='price',y='quantity',color='cluster',orientation='v')
fig.show()
The result clearly shows my newbiew skills: it is clustering the amplitudes, not the regions (amplitude combined with price range). I also tried normalizing the data (each axis subtracted from the dataset mean divided by the standard deviation), but no success.
Maybe it's just a transformation I have to do in the input dataset, so that HDBSCAN clusters the data properly. I'm going for the machine learning process because the dataset will vary its shape, so the parameters of the clustering method will have to adapt and be trained someday. The number of cluster will also vary depending on the data, and it has a carachterist that, as time goes, small regions tend to be visually grouped into a bigger region (like the blue and pink rectangles, which are almost forming one big region).
Finally, maybe just DBSCAN (most known), GaussianMixture or KernelDensity would suffice. I don't know. I'd really appreciate some help here. I tried HDBSCAN due to its density and hierachical approach that really fits my data (many small dense regions can be clustered as a big dense region with peaks).
Although it's a simple question, I'm still new to these algorithms. THANKS in advance!


