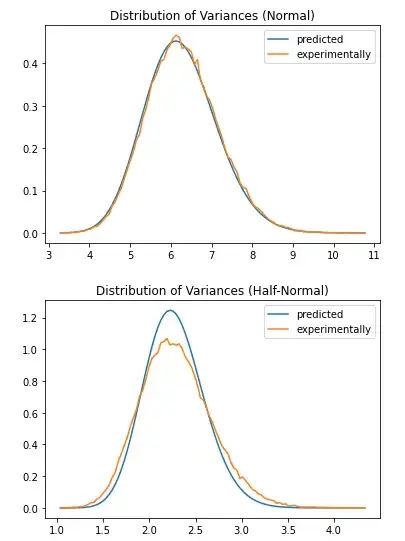
If $X$ is distributed according to a normal distribution with zero-mean $\mathcal{N}(0, \sigma_N^2)$, $Y:=\vert X\vert$ is said to be distributed according to a half-normal distribution, cf. 2.
I am trying to come up with an analytic expression for the distribution of sample-variances of a half-normal distribution in dependency of the sample size $n$ and the variance of the underlying normal distribution $\sigma_N^2$ (why? cf. background):
According to 1, sample-variances $S_N^2$ of a normal distribution are distributed as: $$\tag{1}\label{1} \frac{(n-1)S_N^2}{\sigma_N^2} \sim \chi^2(n-1) \qquad \text{for } S_N^2 := \frac{1}{n-1}\sum_{i=1}^n(X_i-\overline{X})^2. $$
In order to model the distribution of sample variances $S_H^2$ of the half normal, I made use of the following relationship between the normal variance $\sigma_N^2$ and the variance of the associated half-normal $\sigma_H^2$, which is given by 2: $$ \sigma_H^2 = \sigma_N^2\left(1-\frac{2}{\pi}\right). $$ Combining this with \eqref{1} made me think that $S^2_H$ could indeed be distributed as $$\tag{2}\label{2} \frac{(n-1)S_H^2}{\sigma_N^2\left(1-\frac{2}{\pi}\right)} \sim \chi^2(n-1) \qquad \text{for } S_H^2 := \frac{1}{n-1}\sum_{i=1}^n(Y_i-\overline{Y})^2. $$
However, using python experiments (below), I could verify relationship \eqref{1} for $S^2_N$, but not \eqref{2} for $S^2_H$.
Can anyone explain to me why this is happening and what I am missing?
Code
I wrote the following script to verify the relationship.
import numpy as np
import scipy.stats
import matplotlib.pyplot as plt

sigma_N = 2.5
n = 100
N = 100000

def run_experiments(sample_fctn, scale, title):
    # experimental pdf (N simulations)
    X = sample_fctn()
    vars_exp = np.var(X, ddof=1, axis=1)
    pdf_exp, bins = np.histogram(vars_exp * scale, bins=101, density=True)
    # predicted pdf
    pdf_pred = scipy.stats.chi2.pdf(bins[1:], n-1)
    plt.plot(bins[1:], pdf_pred, label='predicted')
    plt.plot(bins[1:], pdf_exp, label='experimental')
    plt.legend()
    plt.title(title)
    plt.show()

# normal case
normal_scale = (n-1) / sigma_N**2
generate_normal_samples = lambda: sigma_N * np.random.randn(N, n)
run_experiments(generate_normal_samples, normal_scale, "Distribution of Variances (Normal)")

# half-normal case
half_normal_scale = (n-1) / ( sigma_N**2 * (1 - 2/np.pi))
generate_half_normal_samples = lambda: np.abs(sigma_N * np.random.randn(N, n))
run_experiments(generate_half_normal_samples, half_normal_scale, "Distribution of Variances (Half-Normal)")
