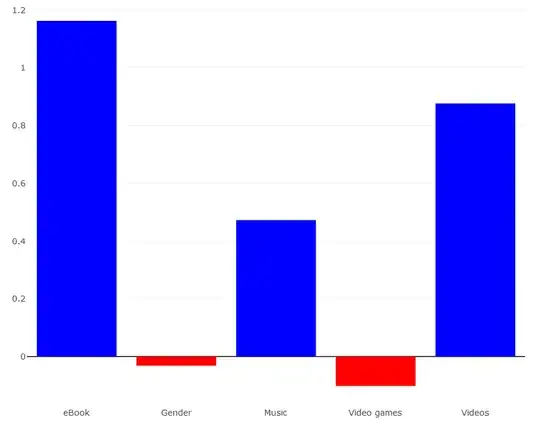
I'm trying to build a LSTM model that takes in 150 consecutive candlesticks' open, high, low, close and EMA indicator values (150, 5), then predicts whether price moves 20 points up or down first.
model = Sequential()
model.add(LSTM(128, return_sequences=True, input_shape=(X_train.shape[1], X_train.shape[2])))
model.add(Dropout(.2))
model.add(BatchNormalization())

model.add(LSTM(128, return_sequences=False))
model.add(Dropout(.2))
model.add(BatchNormalization())

model.add(Dense(32, activation="relu"))
model.add(Dense(1, activation="sigmoid"))

opt = Adam(learning_rate=0.0001)

model.compile(loss='binary_crossentropy', optimizer=opt, metrics=['accuracy'])
However, it appears that the model is unable to 'learn' as the training and validation accuracy is stuck at 50% regardless of the number of epochs. I don't think this is an issue with choosing the incorrect network architecture as I've tried ANN, CNN and RNN which all gave the same accuracy rate of ~50%.
Epoch 1/25
254/254 [==============================] - 83s 311ms/step - loss: 0.7628 - accuracy: 0.4961
Epoch 2/25
254/254 [==============================] - 77s 303ms/step - loss: 0.7377 - accuracy: 0.4995
Epoch 3/25
254/254 [==============================] - 78s 306ms/step - loss: 0.7331 - accuracy: 0.5000
Epoch 4/25
254/254 [==============================] - 77s 304ms/step - loss: 0.7253 - accuracy: 0.5118
Epoch 5/25
254/254 [==============================] - 77s 304ms/step - loss: 0.7211 - accuracy: 0.5155
Epoch 6/25
254/254 [==============================] - 76s 300ms/step - loss: 0.7203 - accuracy: 0.5007
Epoch 7/25
254/254 [==============================] - 76s 301ms/step - loss: 0.7159 - accuracy: 0.5054
Epoch 8/25
254/254 [==============================] - 76s 301ms/step - loss: 0.7083 - accuracy: 0.5128
Epoch 9/25
254/254 [==============================] - 77s 301ms/step - loss: 0.7119 - accuracy: 0.5010
Epoch 10/25
254/254 [==============================] - 76s 300ms/step - loss: 0.7121 - accuracy: 0.4998
I'm using a normalized dataset with a 50/50 split of label values. There are 4782 rows of data (train + test). I've tried different optimizers, and even readjusted the learning rate all the way to 1e-6, all to no avail.
When I plot out the distribution of the predictions, I get a graph like this (x-axis represents index of each prediction, not the frequency):
I suppose this means that the model is indecisive since most of the predictions are centered around ~0.5. Conversely, I'm assuming that a good model should have a distribution resembling a sigmoid curve as it shows great confidence with less indecision.
Can anyone advice me on what went wrong? If this is a case of underfitting, then how do I simply have to get more data?
