I'm trying to find the best way to classify bivariate point patterns in spatstat according to the relationship between two point species:
Point pattern classification with spatstat: what am I doing wrong?
Point pattern classification with spatstat: how to choose the right bandwidth?
I used @Adrian's suggestion from the first link.
  Cancer <- split(cells)[["tumor"]]
  Immune <- split(cells)[["bcell"]]
  Dimmune <- density(Immune,sigma=bw.diggle)
  f <- rhohat(Cancer, Dimmune)
f is a "resource selection function" (RSF) which describes the relationship between the intensity of the Cancer point process and the covariate (here kernel density of Immune with with sigma=bw.diggle as I wanted an automatic bandwidth selection).
After extracting the values of f I ran a hierarchical clustering or K-means on the values.
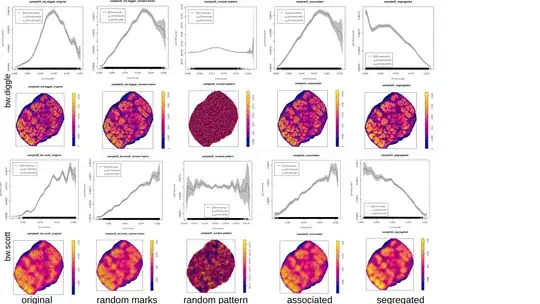
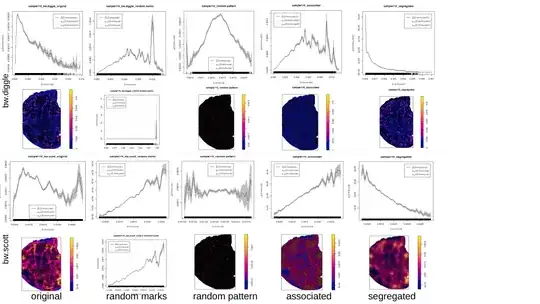
I am in doubt about some results I've got. A dozen of rho-functions looked weird (disrupted, single peak). After changing to default sigma=NULL or sigma=bw.scott (which are smoother) the functions became "better" (see examples below). I also experimented with running the RSF-calculation for patterns with randomly re-assigned marks, or for simulated segregated and clustered patterns in the same window and with the same number of points as the originals (examples below).
I first used bw.diggle for the kernel density calculation, because hopskel.test indicated "clustering" for all my patterns. Now I'm going to use bw.scott for my analysis but can this decision be somehow justified? Is there a better method besides "RSF-function is looking weird"?
some examples:


