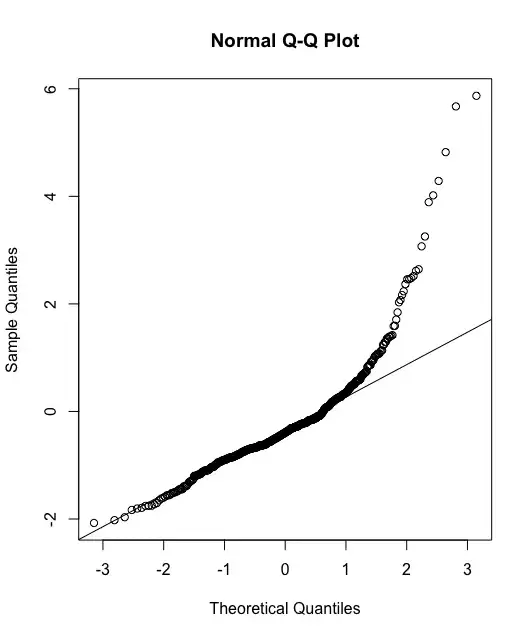
I'm new to modelling count outcomes and was hoping an expert could take a look at the rootogram and Q-Q plot of deviance residual below and let me know how important the misfit is as regards interpreting the model coefficients and S.E.. I know this question looks a bit specific, but in general I keep coming up against this same issue of not knowing how close I must fit to the 0 counts and extreme counts. This issue is covered extensively online and in journals, but I rarely have the type of distribution which neatly fits the zero inflation/truncation models found in these examples.
The output below comes from a negative binomial (R/MASS/glm.nb) of ICU stay, with the standard GOF test indicating the fit is not poor:

