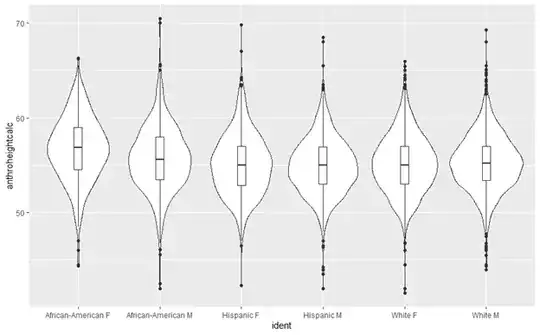
I am using the Shapiro-Wilks test to test for normality in my data. The problem is it seems to be giving me results indicating non-normality even though some of my data is clearly normal.
The p-values for each of the groups here are p = 0.03, 1.52e-05, 3.17e-05, 3.49e-07, 1.43e-06, 5.16e-07. So According to this only african-american females have normally distributed height. Although the other distributions are not very nice I would still call them normal upon visual inspection.
