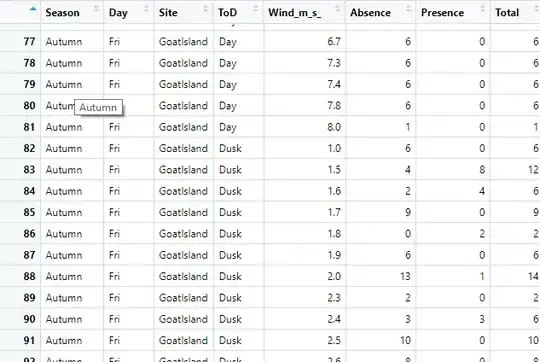
I have a binomial model with a 3-way interaction:
> all.fit <-  glm(cbind(Presence, Total-Presence) ~
                  Season*ToD*Site, family = binomial,
                  data = all.dt)
> summary(all.fit)

Call:
glm(formula = cbind(Presence, Total - Presence) ~ Season * ToD *
    Site, family = binomial, data = all.dt)

Deviance Residuals:
    Min       1Q   Median       3Q      Max
-6.0379  -1.3245  -0.6221   0.3961   8.6824

Coefficients:
                                     Estimate Std. Error z value Pr(>|z|)
(Intercept)                          -4.66074    0.26852 -17.357  < 2e-16 ***
SeasonSpring                          0.60478    0.33133   1.825 0.067959 .
SeasonSummer                         -0.82682    0.48901  -1.691 0.090873 .
SeasonWinter                          1.26868    0.30149   4.208 2.58e-05 ***
ToDDay                                0.09865    0.31530   0.313 0.754381
ToDDusk                               2.48420    0.28183   8.814  < 2e-16 ***
ToDNight                              2.65294    0.27185   9.759  < 2e-16 ***
SiteKawau                             3.09495    0.27605  11.212  < 2e-16 ***
SiteNoises                            3.48048    0.27479  12.666  < 2e-16 ***
SiteTawharanui                        2.94694    0.27684  10.645  < 2e-16 ***
SiteTiritiri                          3.21127    0.27557  11.653  < 2e-16 ***
SeasonSpring:ToDDay                   0.90540    0.37560   2.411 0.015928 *
SeasonSummer:ToDDay                   2.16685    0.52151   4.155 3.25e-05 ***
SeasonWinter:ToDDay                  -0.12465    0.35416  -0.352 0.724863
SeasonSpring:ToDDusk                 -2.78750    0.40957  -6.806 1.00e-11 ***
SeasonSummer:ToDDusk                 -1.52114    0.55644  -2.734 0.006263 **
SeasonWinter:ToDDusk                 -0.90286    0.32121  -2.811 0.004941 **
SeasonSpring:ToDNight                -1.66162    0.34346  -4.838 1.31e-06 ***
SeasonSummer:ToDNight                -1.85826    0.51861  -3.583 0.000339 ***
SeasonWinter:ToDNight                -0.21758    0.30592  -0.711 0.476946
SeasonSpring:SiteKawau               -0.67217    0.34426  -1.953 0.050875 .
SeasonSummer:SiteKawau                1.24760    0.49690   2.511 0.012047 *
SeasonWinter:SiteKawau               -1.68237    0.31709  -5.306 1.12e-07 ***
SeasonSpring:SiteNoises              -0.79023    0.34223  -2.309 0.020940 *
SeasonSummer:SiteNoises               0.42570    0.49791   0.855 0.392560
SeasonWinter:SiteNoises              -0.73055    0.31139  -2.346 0.018972 *
SeasonSpring:SiteTawharanui          -0.25773    0.34405  -0.749 0.453794
SeasonSummer:SiteTawharanui           1.32456    0.49760   2.662 0.007770 **
SeasonWinter:SiteTawharanui          -0.51055    0.31368  -1.628 0.103604
SeasonSpring:SiteTiritiri            -0.48838    0.34274  -1.425 0.154178
SeasonSummer:SiteTiritiri             0.93694    0.49749   1.883 0.059656 .
SeasonWinter:SiteTiritiri            -1.27870    0.31406  -4.072 4.67e-05 ***
ToDDay:SiteKawau                      0.70933    0.32351   2.193 0.028335 *
ToDDusk:SiteKawau                    -2.35320    0.29549  -7.964 1.67e-15 ***
ToDNight:SiteKawau                   -5.33351    0.29943 -17.812  < 2e-16 ***
ToDDay:SiteNoises                     0.27852    0.32258   0.863 0.387906
ToDDusk:SiteNoises                   -2.53814    0.29389  -8.636  < 2e-16 ***
ToDNight:SiteNoises                  -4.04432    0.28257 -14.313  < 2e-16 ***
ToDDay:SiteTawharanui                -0.16455    0.32550  -0.506 0.613193
ToDDusk:SiteTawharanui               -2.76975    0.29927  -9.255  < 2e-16 ***
ToDNight:SiteTawharanui              -2.62701    0.28227  -9.307  < 2e-16 ***
ToDDay:SiteTiritiri                   0.77569    0.32307   2.401 0.016350 *
ToDDusk:SiteTiritiri                 -2.27149    0.29441  -7.715 1.21e-14 ***
ToDNight:SiteTiritiri                -4.15841    0.28495 -14.593  < 2e-16 ***
SeasonSpring:ToDDay:SiteKawau        -0.19831    0.38943  -0.509 0.610596
SeasonSummer:ToDDay:SiteKawau        -1.61316    0.53079  -3.039 0.002372 **
SeasonWinter:ToDDay:SiteKawau         0.57193    0.37047   1.544 0.122635
SeasonSpring:ToDDusk:SiteKawau        2.48229    0.43071   5.763 8.25e-09 ***
SeasonSummer:ToDDusk:SiteKawau        1.37786    0.56992   2.418 0.015622 *
SeasonWinter:ToDDusk:SiteKawau        0.81702    0.34933   2.339 0.019347 *
SeasonSpring:ToDNight:SiteKawau       1.41405    0.40613   3.482 0.000498 ***
SeasonSummer:ToDNight:SiteKawau       2.06227    0.54597   3.777 0.000159 ***
SeasonWinter:ToDNight:SiteKawau       0.08689    0.36989   0.235 0.814279
SeasonSpring:ToDDay:SiteNoises       -0.28007    0.38782  -0.722 0.470188
SeasonSummer:ToDDay:SiteNoises       -1.48112    0.53201  -2.784 0.005369 **
SeasonWinter:ToDDay:SiteNoises       -0.06044    0.36566  -0.165 0.868708
SeasonSpring:ToDDusk:SiteNoises       1.93847    0.43143   4.493 7.02e-06 ***
SeasonSummer:ToDDusk:SiteNoises       0.63232    0.57685   1.096 0.273006
SeasonWinter:ToDDusk:SiteNoises       0.83278    0.34003   2.449 0.014321 *
SeasonSpring:ToDNight:SiteNoises      0.69621    0.37365   1.863 0.062422 .
SeasonSummer:ToDNight:SiteNoises      0.06911    0.55930   0.124 0.901655
SeasonWinter:ToDNight:SiteNoises      0.48690    0.32194   1.512 0.130428
SeasonSpring:ToDDay:SiteTawharanui   -0.23150    0.39050  -0.593 0.553287
SeasonSummer:ToDDay:SiteTawharanui   -1.96624    0.53250  -3.692 0.000222 ***
SeasonWinter:ToDDay:SiteTawharanui    0.43487    0.36870   1.179 0.238216
SeasonSpring:ToDDusk:SiteTawharanui   2.04614    0.43633   4.689 2.74e-06 ***
SeasonSummer:ToDDusk:SiteTawharanui   0.59597    0.57680   1.033 0.301491
SeasonWinter:ToDDusk:SiteTawharanui   0.73280    0.34653   2.115 0.034456 *
SeasonSpring:ToDNight:SiteTawharanui  1.02467    0.36109   2.838 0.004544 **
SeasonSummer:ToDNight:SiteTawharanui  1.19957    0.52990   2.264 0.023589 *
SeasonWinter:ToDNight:SiteTawharanui -0.16571    0.32155  -0.515 0.606306
SeasonSpring:ToDDay:SiteTiritiri     -0.49278    0.38807  -1.270 0.204143
SeasonSummer:ToDDay:SiteTiritiri     -1.63113    0.53142  -3.069 0.002145 **
SeasonWinter:ToDDay:SiteTiritiri      0.37405    0.36773   1.017 0.309069
SeasonSpring:ToDDusk:SiteTiritiri     1.81283    0.43042   4.212 2.53e-05 ***
SeasonSummer:ToDDusk:SiteTiritiri     0.83455    0.57225   1.458 0.144744
SeasonWinter:ToDDusk:SiteTiritiri     0.50070    0.34463   1.453 0.146263
SeasonSpring:ToDNight:SiteTiritiri    1.49159    0.36761   4.057 4.96e-05 ***
SeasonSummer:ToDNight:SiteTiritiri    1.30689    0.53796   2.429 0.015127 *
SeasonWinter:ToDNight:SiteTiritiri    0.79478    0.32728   2.428 0.015164 *
---
Signif. codes:  0 ‘***’ 0.001 ‘**’ 0.01 ‘*’ 0.05 ‘.’ 0.1 ‘ ’ 1

(Dispersion parameter for binomial family taken to be 1)

    Null deviance: 104046  on 22997  degrees of freedom
Residual deviance:  62740  on 22918  degrees of freedom
AIC: 86778

Number of Fisher Scoring iterations: 6
I have reported the significance of the three way interaction. And now I want to do some comparisons, for example, say Winter at one Site had a higher proportion than Winter at another site. Can I do this following the example here, by changing the level order? (https://rpubs.com/raoulbia/interpreting_glm_logistic_regression_output)
