2

I'm exploring some manual approaches to understand whether specific changes on a site can be deemed conclusive and statistically significant.

I appreciate that any A/B testing platform has a reporting part of doing this job; however, changes have been implemented without any platform, so my best bet was pulling out data and doing this exercise manually.

The scenario

36 pages, 24 of which have a feature the remaining 12 have not.

Looking at the daily traffic values, traffic rose by +50% on the group where the feature is in. But I need to provide a confidence interval or a statistically significant coefficient for the senior management.

The two groups of data (8760 & 4380 entries respectively) are heteroscedastic (Levene test suggests it) and not normally distributed (after all they are traffic data).

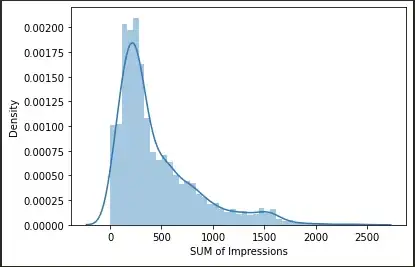
enter image description here

enter image description here

Note: I believe the data are not normally distributed as the bell curve is not properly centered, but I might be wrong in saying so. Still have to gain experience in this field.

The result

When running a Welch's test as below, I get a p-value that is absnormal:

stats.ttest_ind(faq['traffic'], no_faq['traffic'], equal_var=False, axis=0)

Ttest_indResult(statistic=-23.253270956567135, pvalue=1.3551062210749643e-114)

Now, if the H0 is that the page feature does not influence the traffic, the high p-value here confirms me the opposite.

Question

What I'm struggling to understand is the very high p-value that goes beyond the 100% mark. Am I doing something wrong? Should I use a different test? What to calculate a confidence score?
Andrea Moro
  • 163
  • 6
  • 1
    *"What I'm struggling to understand is the very high p-value that goes beyond the 100% mark"*. But the p-value is close to zero !!! – Robert Long Jun 16 '21 at 16:15
  • If your data is non-normal, you may wish to reconsider the use of an independent Welch's test. See this [Q/A](https://stats.stackexchange.com/questions/530812/t-test-states-difference-of-donation-is-significant-when-z-test-claims-not-what/530818#530818). – DifferentialPleiometry Jun 16 '21 at 16:16

2 Answers2

1

You're saying the p-value is really high, but it is the opposite. Your p-value is really small, but you may be overlooking the scientific notation.

$P=$1.3551062210749643e-114$ = \frac{1.3551062210749643}{10^{114}} \approx \frac{1}{10^{114}} << 0.05 = \alpha$

DifferentialPleiometry
  • 2,274
  • 1
  • 11
  • 27
  • I am possibly doing so, have still few concept of statistic that I need to grasp well. So given is so small... the null hypothesis is confirmed, so there is no evidence the new features have had any effect? How else can I explain/explore this? – Andrea Moro Jun 16 '21 at 16:09
  • Actually, you're right, I was too focused in reading the other way round. So, correct me whether I'm wrong, I basically have 100% of statistical significance. Should I add anything else for the sake of communication? BTW appreciated the other link – Andrea Moro Jun 16 '21 at 16:21
  • @AndreaMoro Non-normality of the data notwithstanding, the interpretation of your Welch test is that the two groups are significantly different under an 95% confidence. – DifferentialPleiometry Jun 16 '21 at 16:26
  • @AndreaMoro For communication, I suggest you include visualizations that show what your statistics are indicating. It might seem redundant, but it can really clarifying what the stats are saying to your target audience. – DifferentialPleiometry Jun 16 '21 at 16:28
  • (+1) visualizations are so often overlooked ! – Robert Long Jun 16 '21 at 20:04
  • Definitely I need to do something, and I totally stand what you guys said. Without visual it will difficult to let people understand. Though the nature of data doesn't suggest me anything better than a cumulative traffic aggregated by day. Anything else you can think of? – Andrea Moro Jun 17 '21 at 07:48
  • @AndreaMoro One suggestion that relates to the hypothesis test itself is to (1) pair the counts by date, (2) calculate the date-wise difference in the counts, then (3) plot a histogram of those differences. If one group was clearly greater than the other, then you should not see the distribution overlap with zero. – DifferentialPleiometry Jun 17 '21 at 14:57
1

You are testing whether 2 independent samples have the same expected values.

"What I'm struggling to understand is the very high p-value that goes beyond the 100% mark".

The p-value is low, not high. As for interpretation: If these two samples actually have the same expected value, then the probability of observing these data, or data even more extreme, is very low.

It would be a good idea to check if these data are approximately normally distributed.

Robert Long
  • 53,316
  • 10
  • 84
  • 148
  • How can I check for normal distribution if the data are split by page and date? I don't think this is possible. I can group by date, but the overall result is still a time series. The only way I can think is to group by the value I'm testing and add a count every time a given item is found? – Andrea Moro Jun 16 '21 at 17:52
  • @AndreaMoro You should be able to check whether `faq['traffic']` and `no_faq['traffic']` are normally distributed. – DifferentialPleiometry Jun 16 '21 at 19:16
  • I'm not sure why page and date have anything to do with the distribution ? Perhaps you can post a plot of the histograms of both samples. ie if using `matplotlib` then `hist()` or `histogram()` in `numpy`. – Robert Long Jun 16 '21 at 20:01
  • All I mean is that - by nature - those values are unlikely to be normally distributed because I have an uplift. But thinking to it more rationally, this might not always be the case. So I did update the post above to include a couple of chart just for completeness. – Andrea Moro Jun 17 '21 at 07:56
  • Does this answer your question ? If so please consider marking it as the accepted answer. If not, please let us know why. Also, if you haven't already, please consider upvoting it. – Robert Long Jun 26 '21 at 12:21