3

As a newbie, I am trying to implement the forecast using the auto Arima model. After searching, I found this site illustrates the usage and the hyperparameters used in the model. However, when I tried to forecast, the model gave me an array of constants.

Please advise if I asked in the wrong place. Thanks.

The data is a simple 29 days data:

daily_infect = [ 15,  11,  21,  25,  32, 186, 204, 334, 242, 274, 294, 315, 722,
       453, 594, 536, 640, 672, 557, 489, 358, 351, 330, 548, 582, 474,
       506, 325, 214]

Here is the code:

# reference: https://alkaline-ml.com/pmdarima/modules/generated/pmdarima.arima.auto_arima.html
import pmdarima as pm
model = pm.auto_arima(daily_infect,
                      start_p=2, start_q=2, # default=2
                      test='kpss',       # default=kpss
                      max_p=5, # default=5 
                      max_q=2, # default=2
                      m=1,              # Note that if m == 1 (i.e., is non-seasonal)
                      d=None,           # If None (by default), the value will automatically be selected based on the results of the test
                      seasonal=False,   # No Seasonality
                      start_P=1,        # default=1
                      D=None,           # The order of the seasonal differencing. If None (by default, the value will automatically be selected based on the results of the seasonal_test
                      trace=True,
                      error_action='warn',  # default=warn
                      stepwise=True)    # The stepwise algorithm can be significantly faster than fitting all (or a random subset of) hyper-parameter combinations and is less likely to over-fit the model.

print(model.summary())

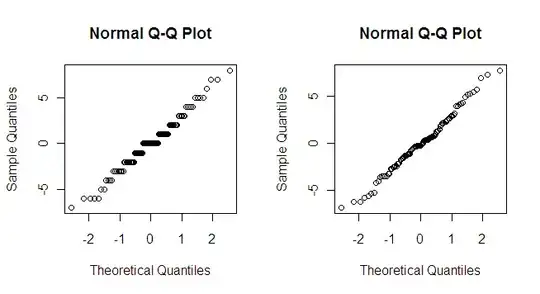
I ran the diagnose. It seems okay

model.plot_diagnostics(figsize=(15,8))
plt.show()

diagonose

Here is the forecast code:

# Forecast
n_days = 10
fc = model.predict(n_periods=n_days)
index_of_fc = np.arange(len(daily_infect), len(daily_infect)+n_days)

# make series for plotting purpose
fc_series = pd.Series(fc, index=index_of_fc)

# Plot
fig, ax = plt.subplots(figsize=(15,9))
ax.plot(daily_infect)
ax.plot(fc_series, color='red')

ax.set_title("Final Forecast")
ax.figure.autofmt_xdate()
plt.show()

The constant prediction

What I've tried is to change some parameters back to default, but no luck. Is there's anything I can improve? Thanks.
Woden
  • 167
  • 8
  • 2
    What else would you expect it to predict? There is no trend, no cyclic changes... – Tim Jun 08 '21 at 12:26
  • What I think is that the model predicts based on the lags (AR), and the error of the lagged forecast (MR). Is it necessary to have cyclic changes to forecast? Thanks. – Woden Jun 08 '21 at 12:33
  • 2
    All time-series models are about seeking patterns in data, i.e. trends, or cycles that periodically repeat, otherwise, what would they use as a base for making a forecast..? If there are no cycles and no trend, you don't know what will come next. – Tim Jun 08 '21 at 12:36
  • Thank you for the explanation. Understood. – Woden Jun 08 '21 at 12:38
  • 1
    Please provide *working* code. As in: your code should run in a new Python console (assuming modules are installed). Also, Tim is absolutely right. You may want to look through [previous questions on flat ARIMA forecasts](https://stats.stackexchange.com/search?q=arima+flat). Or at [Is it unusual for the MEAN to outperform ARIMA?](https://stats.stackexchange.com/q/124955/1352) – Stephan Kolassa Jun 08 '21 at 12:41
  • @StephanKolassa thanks! I'll look into it and add the code. – Woden Jun 08 '21 at 12:42
  • 1
    I'll happily take a look at your question and bring some knowledge about ARIMA to the table, but being a complete Python n00b, your call to `array` is what threw me off. If you make it easy for people to help you, you will get better answers. – Stephan Kolassa Jun 08 '21 at 12:44
  • @StephanKolassa the code should work now. Thank you. – Woden Jun 08 '21 at 12:48
  • 1
    Series look like a random walk to me. What output do you get on `print(model.summary())`? – Daniel R Jun 08 '21 at 12:58
  • @DanielR I'll add the result as well. – Woden Jun 08 '21 at 12:59

1 Answers1

5

Here is what your call to pm.auto_arima() writes to the console:

Best model:  ARIMA(0,1,0)(0,0,0)[0]

That is, it fits a non-seasonal (that's the trailing (0,0,0)[0] part, and it's not surprising, since you specified seasonal=False) ARIMA(0,1,0) model. This is an ARMA(0,0) model on first differences, or

$$ By_t = y_t-y_{t-1} = \epsilon_t, $$

where $B$ is the backshift operator, and $\epsilon_t\sim N(0,\sigma^2)$. Alternatively,

$$ y_t=y_{t-1}+\epsilon_t. $$

That is, a random walk.

In forecasting, you substitute the expected value for the innovations $\epsilon_t$, which is zero. Thus, your forecasts are simply the last observation. In particular, the forecasts do not vary over time, so you get a flat line.

Now you will probably wonder why auto_arima() fits a random walk. As Tim writes, there is no obvious cycles or trends in your data, and the stepwise AIC optimization does not find meaningful autocorrelation or moving average dynamics in your time series. So auto_arima() indeed believes a random walk is the best description of your data.

You may want to look through previous questions on flat ARIMA forecasts. Or at Is it unusual for the MEAN to outperform ARIMA? A flat forecast - whether from the overall average, as discussed in the last link, or whether from a random walk model - is surprisingly often the best forecast you can make. If there is no structure to be found, then there is no structure to be found.

I recommend the excellent free online book Forecasting: Principles and Practice (2nd ed.) by Athanasopoulos & Hyndman. It uses R, not Python, but it's very good, accessible, and free.

Stephan Kolassa
  • 95,027
  • 13
  • 197
  • 357