0

I don't know if it is a good question or a well-defined question, but I really need some suggestions! Any suggestion is valuable for me! Very much thanks! The question is:

There are many attributions of a research subject, which can be quantified as variables such as X, Y, Z, and they may not necessarily have the same units. Every variable has its unique distribution of course. Now I want to know which variable is more consistent or invariant for the research subject.

I've considered several methods to do that, for example:

(1) Randomly choose m values and repeat it n times(bootstrap), then I get n sets of sampling data. Since every set of sampling data has a distribution, calculate the pairwise distances between the n distributions. The fewer the distances are, the more invariant the variable is.

(2) Train an LDA classifier to classify the subclass of my research subject with a variable. The worse a variable shows to be in classification, the more invariant the variable is.

I believe there must be some very elegant method in statistics however I'm poor in statistics so I really need help!!!
C.K.
  • 101
  • 3
  • 1
    I guess you don't want to use the variance, because the variance of a variable changes if you scale it by a constant, am I right? Then I think you have to look at some correlation instead (like you do in (2)). Is it meaningful to convert the subclass-annotater into a numeric variable? Then you can just compute the normal Pearson correlation. – svendvn Jun 06 '21 at 11:09
  • @svendvn Yes, you're right! I don't want to use the variance because the variables differ in units and mean, and therefore I don't think the variance is a good measure for the comparison. And your idea is very good and helpful for me! Yes, I can compute the correlation coefficient between the variable values and the subclass labels. That's more convenient than the classification algorithm training. – C.K. Jun 06 '21 at 14:23
  • @svendvn But since the subclass method is somewhat an "indirect" way to measure the dispersion, I want to know are there some mathematical methods to directly measure the dispersion of a distribution and the result can directly be used in the comparison of distributions with different units and means. For example, distance values such as JS divergences can be obtained with my method (1)(even though I have no idea is that plausible), and then they can be compared between different variables since the values of them are always in `[0,1]`. – C.K. Jun 06 '21 at 14:25
  • 1
    yes correlation with subclasses should probably be interpreted in another way than the variance. Your method (1) seems interesting - I have not seen it before, and it might work. Another thing; perhaps the coefficient of variation could work for your variables. Have you looked at that? – svendvn Jun 06 '21 at 15:42
  • @svendvn Thanks for your comment! Yes, I've considered the coefficient of variation but I'm not sure if the simple coefficient of variation is a reliable parameter since no confidence intervals can be computed. Of course, it can't be worse than my two methods above, lol. – C.K. Jun 06 '21 at 16:15
  • 1
    I don't think they are bad, but perhaps a bit complicated ;) you can compute confidence interval of the coefficient of variation (cv) using bootstrap but I don't think they are that important. What is more important is that " The coefficient of variation should be computed only for data measured on a ratio scale, that is, scales that have a meaningful zero"(https://en.wikipedia.org/wiki/Coefficient_of_variation#Definition) – svendvn Jun 06 '21 at 18:35
  • Provided the random variables are positive,, CV may make sense. You could get bootstrap CIs. // But considering that X, Y, Z might be highly correlated, there is a possibility some combination of them might be better than any one individually. – BruceET Jun 06 '21 at 19:40
  • In the generality with which you have asked this question, it is tantamount to asking whether five miles is greater than five pounds. "Consistent ... for the research subject" must depend on the research and its needs. – whuber Jun 06 '21 at 22:12
  • @BruceET Yes, so as I wrote in the question description. I even have no idea if the question is a well-defined question. But to learn some possible methods and their usage cases is enough for me, and I'll pick the most useful one for me. – C.K. Jun 07 '21 at 02:49
  • @svendvn Very much to your suggestion and I'll try on the CV! – C.K. Jun 07 '21 at 02:51

1 Answers1

3

Comment continued:

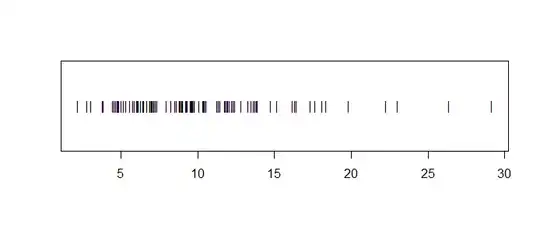
Suppose you have $n = 100$ observations x with summary statistics and stripchart as follows:

summary(x)
   Min. 1st Qu.  Median    Mean 3rd Qu.    Max. 
  2.199   6.683   9.177  10.019  12.028  29.168 
sd(x); cv.obs = sd(x)/mean(x); cv.obs
[1] 4.888695   # sample SD
[1] 0.4879217  $ sample CV

stripchart(x, pch="|")

enter image description here

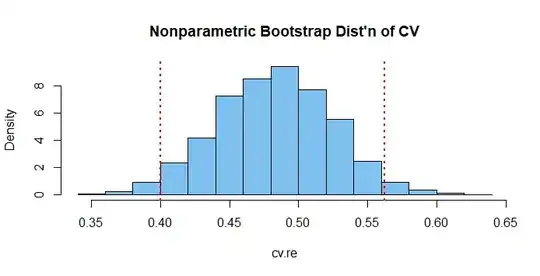
Then a simple quantile 95% nonparametric bootstrap CI of the population CV from R is $(0.40, 0.56).$

cv.obs = sd(x)/mean(x)
set.seed(1235)
m = 3000;  cv.re = numeric(m)
for(i in 1:m) {
 x.re = sample(x, 100, rep=T)
 cv.re[i] = sd(x.re)/mean(x.re)}
CI = quantile(k.re, c(.025,.975));  CI
     2.5%     97.5% 
0.4000557 0.5625293
hist(cv.re, prob=T, col="skyblue2", main=hdr)
 abline(v = CI, col="red", lwd=2, lty="dotted")

enter image description here

This type of CI has been deprecated for asymmetrical bootstrap distributions. A bootstrap CI using differences cv.re - cv.obs gave CI $(0.41, 0.58)$ and (because CV can sometimes be viewed as a scale parameter) bootstrapping ratios cv.re/cv.obs gave CI $(0.42, 0.60).$

Note: The data were sampled in R as follows:

set.seed(1234)
x = rgamma(100, 5, .5)

The population CV is $1/\sqrt{5} = 0.4472,$ which is included in all three CIs shown above.

[Of course, if I had used the information that data are gamma distributed, a parametric CI would have been possible.]

BruceET
  • 47,896
  • 2
  • 28
  • 76
  • 3
    Using a coefficient of variation is equivalent to saying that the standard deviation of logarithms makes sense, and both are equivalent to saying that you are looking at relative variability. The coefficient of variation can indeed be useful -- it is a natural measure for e.g. gamma and lognormal distributions -- but like anything it can be oversold. For some cautions see https://stats.stackexchange.com/questions/118497/how-to-interpret-the-coefficient-of-variation – Nick Cox Jun 06 '21 at 22:08
  • Very much thanks! That's very useful! – C.K. Jun 07 '21 at 02:52