10

If I were to define the coordinates $(X_{1},Y_{1})$ and $(X_{2},Y_{2})$ where

$$X_{1},X_{2} \sim \text{Unif}(0,30)\text{ and }Y_{1},Y_{2} \sim \text{Unif}(0,40).$$

How would I find the expected value of the distance between them?

I was thinking, since the distance is calculated by $\sqrt{(X_{1}-X_{2})^{2} + (Y_{1}-Y_{2})^{2}})$ would the expected value just be $(1/30 + 1/30)^2 + (1/40+1/40)^2$?

whuber
  • 281,159
  • 54
  • 637
  • 1,101
Mathlete
  • 403
  • 2
  • 5
  • 13
  • Your LaTeX code was not rendering correctly. I hope my fix is what you intended – Peter Flom Mar 21 '13 at 11:12
  • Almost, but it helped get me there in the end, many thanks. – Mathlete Mar 21 '13 at 11:14
  • 2
    Equivalent question on the math site: [Average Distance Between Random Points in a Rectangle](http://math.stackexchange.com/q/208666/7003). A related question: [Probability that uniformly random points in a rectangle have Euclidean distance less than a given threshold](http://stats.stackexchange.com/q/22488/2970). (Unfortunately, I never got around to taking up @whuber on his suggestions there. I'll try to find some time to do that.) – cardinal Mar 21 '13 at 17:49
  • 1
    Thanks for those links, @cardinal. Although the math version does not explain the answer--it just presents it--it contains links to one derivation, which is worth reviewing. – whuber Mar 21 '13 at 20:02

2 Answers2

16

It is plain, from looking at the question geometrically, that the expected distance between two independent, uniform, random points within a convex set is going to be a little less than half its diameter. (It should be less because it's relatively rare for the two points to be located within extreme areas like corners and more often the case they will be near the center, where they are close.) Since the diameter of this rectangle is $50$, by this reasoning alone we would anticipate the answer to be a little less than $25$.

An exact answer is obtained from the definition of expectation as the probability-weighted value of the distance. In general, consider a rectangle of sides $1$ and $\lambda$; we will scale it up to the correct size afterwards (by setting $\lambda = 40/30$ and multiplying the expectation by $30$). For this rectangle, using coordinates $(x,y)$, the uniform probability density is $\frac{1}{\lambda}dx dy$. The mean distance within this rectangle then is given by

$$\int_0^\lambda\int_0^1\int_0^\lambda\int_0^1 \sqrt{(x_1-x_2)^2+(y_1-y_2)^2} \frac{1}{\lambda}dx_1 dy_1 \frac{1}{\lambda} dx_2 dy_2.$$

Using elementary integration methods this is straightforward but painful to do; I employed a computer algebra system (Mathematica) to obtain the answer

$$[2+2 \lambda ^5-2 \sqrt{1+\lambda ^2}+6 \lambda ^2 \sqrt{1+\lambda ^2}-2 \lambda ^4 \sqrt{1+\lambda ^2} +5 \lambda \text{ArcSinh}(\lambda)+5 \lambda ^4 \log\left(\frac{1+\sqrt{1+\lambda ^2}}{\lambda }\right)]/(30\lambda^2).$$

The presence of $\sqrt{1+\lambda^2}$ in many of these terms is no surprise: it is the diameter of the rectangle (the maximum possible distance between any two points within it). The appearance of logarithms (which includes the arcsinh) is also unsurprising if you have ever investigated average distances within simple plane figures: somehow it always shows up (a hint of this appears in integral of the secant function). Incidentally, the presence of $30$ in the denominator has nothing to do with the specifics of the problem involving a rectangle of sides $30$ and $40$: it's a universal constant.)

With $\lambda=4/3$ and scaling up by a factor of $30$, this evaluates to $\frac{1}{108} (871+960 \log(2)+405 \log(3)) \approx 18.345919\ldots$.


One way to understand the situation more deeply is to plot the mean distance relative to the diameter of $\sqrt{1+\lambda^2}$ for varying values of $\lambda$. For extreme values (near $0$ or much greater than $1$), the rectangle becomes essentially one-dimensional and a more elementary integration indicates the mean distance should reduce to one-third the diameter. Also, because the shapes of rectangles with $\lambda$ and $1/\lambda$ are the same, it is natural to plot the result on a logarithmic scale of $\lambda$, where it must be symmetric about $\lambda=1$ (the square). Here it is:

Plot

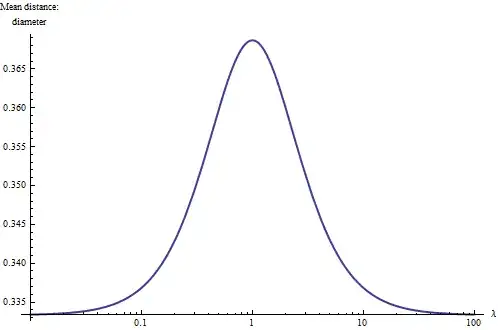
With this we learn a rule of thumb: the mean distance within a rectangle is between $1/3 \approx 0.33$ and (approximately) $0.37$ of its diameter, with the larger values associated with squarish rectangles and the smaller values associated with long skinny (linear) rectangles. The midpoint between these extremes is achieved roughly for rectangles with aspect ratios of $3:1$. With this rule in mind, you can just glance at a rectangle and estimate its mean distance to two significant figures.

whuber
  • 281,159
  • 54
  • 637
  • 1,101
  • Should that be "diagonal" instead of "diameter"? Sorry if I am nitpicking. – curious_cat Mar 21 '13 at 17:16
  • @curious_cat By definition, the diameter of a set of points (in any metric space) is the supremum of the distances between any two points in it. For a rectangle it is (obviously) the length of a diagonal. – whuber Mar 21 '13 at 17:19
  • Thanks! I did not realize that. I was using a naive concept of diameter. – curious_cat Mar 21 '13 at 17:24
  • As an aside: For all rectangles of given area would the mean distance be minimized for a square? – curious_cat Mar 21 '13 at 17:26
  • @curious_cat No, because among these rectangles are some that are arbitrarily long. *E.g.*, if we restrict to unit areas, then the rectangle of dimensions $\sqrt{\lambda}$ and $1/\sqrt{\lambda}$ has unit area and aspect ratio $\lambda$. As we see here, for very large $\lambda$ the mean distance is close to $\lambda/3$, which is unbounded. – whuber Mar 21 '13 at 17:29
  • Sorry if I am again confused. But what you just described is the maximization case, isn't it? I was asking about the minimum of the mean distance. – curious_cat Mar 21 '13 at 17:37
  • @curious_cat My apologies--I read your question completely backwards. Yes, you are correct, and that result can be obtained using the formulas derived here. – whuber Mar 21 '13 at 17:44
  • 2
    In the spirit of [this](http://stats.stackexchange.com/questions/29121/intuitive-explanation-of-unit-root/29129#comment55107_29129), I wish you would have started this answer with "It is *plane* ..." (+1) – cardinal Mar 21 '13 at 17:49
  • @whuber: It'd be fun to paste your $[2+2 \lambda ^5-2 \sqrt{1+\lambda ^2}+6 \lambda ^2 \sqrt{1+\lambda ^2}-2 \lambda ^4 \sqrt{1+\lambda ^2} +5 \lambda \text{ArcSinh}(\lambda)+5 \lambda ^4 \log\left(\frac{1+\sqrt{1+\lambda ^2}}{\lambda }\right)]/(30\lambda^2).$ into Mathematica and ask it to minimize for $\lambda$ :) Wonder if it'd get 1. – curious_cat Mar 21 '13 at 17:51
  • @curious_cat You don't need software for that: this is the limiting mean distance as the rectangle maintains a width of $1$ and its height shrinks to $0$; the value is $1/3$. – whuber Mar 21 '13 at 19:55
2
##problem
x <- runif(1000000,0,30)
y <- runif(1000000,0,40)
Uniform <- as.data.frame(cbind(x,y))
n <- nrow(Uniform)
catch <- rep(NA,n)
for (i in 2:n) {
      catch[i] <-((x[i+1]-x[i])^2 + (y[i+1]-y[i])^2)^.5
}
mean(catch, na.rm=TRUE)
18.35855

If I understand correctly what you're looking for, maybe this helps. You're trying to figure out the distance between to random points, who's X values are generated from unif(0,30) and Y values are generated from a unif (0,40). I just created a million RV's from each of those to distributions and then bound the x and the y to create a point for each of them. Then I calculated the distance between point 2 and 1 all the way to the distance between points 1,000,000 and 999,999. The average distance was 18.35855. Let me know if this isn't what you were looking for.

curious_cat
  • 1,043
  • 10
  • 28
Eric Peterson
  • 2,323
  • 14
  • 20
  • 2
    You came fairly close--perhaps by chance. The true answer is $\frac{1}{108} (871+960 \log(2)+405 \log(3))$ = $18.345919\ldots$. Your code has two problems: (1) the iterations are not mutually independent; and (2) to obtain reasonable precision, it ought to be coded to be faster. Why not do the simulation directly, as in `n – whuber Mar 21 '13 at 15:32
  • @whuber: Can you explain your #1? e.g. say (Case-I) I drew pairs of random numbers from any given distribution and calculated differences and took a mean. Versus (Case-II) I kept drawing one number at a time and kept calculating running differences with respect to the last number draw and then averaged. Would the average reported by Case-I and Case-II be systematically different? – curious_cat Mar 21 '13 at 16:45
  • 1
    @curious_cat No, the averages would be about the same: but the calculation of the *standard error* would be different. We need that calculation in order to estimate how close the mean is likely to come to the true value. Rather than work out the more complicated SE calculation, it's simpler just to generate pairs of points completely independently of one another, exactly as stipulated in the question. (There are so many ways a simulation can go wrong--I know from experience!--that it's wise to make the simulation mimic the reality as closely as possible.) – whuber Mar 21 '13 at 16:52
  • @whuber: Thanks for clarifying. So, if Clark had run his code longer he might have gotten more decimal places right? – curious_cat Mar 21 '13 at 16:55
  • @curious_cat Yes, but--as usual--with quadratically diminishing returns, which limit the precision of any such simulation. Running it ten times longer (about 20 seconds on my machine) would have achieved four significant figures. The next s.f. would require a run $100$ times longer, or about half an hour. The next one would need two days, etc. A good use for such simulations is to check theoretical calculations; occasionally, when only low precision is needed and no analytical insight into the nature of the solution is desired, a simulation alone will suffice to answer a question. – whuber Mar 21 '13 at 17:00
  • @whuber I did wonder after I gave my answer if I had actually been wrong to considier each x and y as independent draws. I probably answered the question too quickly. And I definitely wrote the loop in an awkward fashion. I should have done better there too. – Eric Peterson Mar 21 '13 at 17:10
  • Nevertheless, I think it is an interesting and worthwhile contribution (+1). – whuber Mar 22 '13 at 14:38
  • @whuber could you please explain why std error would be different between these two methods? I have a similar issue posted here: http://stats.stackexchange.com/questions/222878/difference-between-two-methods-of-random-point-generation – Swair Jul 09 '16 at 14:39
  • @swair Consider the simplest case where one method draws three independent variates $x,y,z$ from a distribution and uses the distances $d(y,x)$ and $d(z,y)$ as a sample of distances. The alternative draws *four* variates $x,y,z,w$ and uses the distances $d(y,x)$ and $d(w,z)$ as a sample of distances. In the second case the two distances are independent. In the first case the two distances are not independent--and likely correlated--because they both are distances from a common point $y$. If $y$ happens to be extreme, then likely both distances will be large: that's positive correlation. – whuber Jul 11 '16 at 15:25