I'm fairly new to time series analysis and forecasting. I'm using the uci househould power consumption dataset to build a model to forecast energy consumption.
The dataset measures the power (kW) averaged during a 1 minute period, but I'm interested in energy (kWh), so I divide by 60 and I resample to change the frequency to hours.
power_consumption['Global_active_power'] = power_consumption['Global_active_power'].apply(lambda x: x/60)
power_consumption=power_consumption.resample('h').sum()
Once, I have the dataset the way it fits my needs I want to check if the time series is stationary, and then is where I'm getting confused.
When I run the ADFuller test I get the following:
result = adfuller(power_consumption['Active_Energy'])
print(f'ADF Statistic: {result[0]}')
print(f'p-value: {result[1]}')
for key, value in result[4].items():
    print('Critial Values:')
    print(f'   {key}, {value}')

ADF Statistic: -14.279731281927612
p-value: 1.3303299942732509e-26
Critial Values:
   1%, -3.4305393559398922
Critial Values:
   5%, -2.8616236906108443
Critial Values:
   10%, -2.566814545887977
So, having such p-value is fair to assume that the time series is stationary, right?
Then I plot the ACF and PACF and I get the following:
lag=240
plot_acf(power_consumption['Active_Energy'],lags=lag )
pyplot.show()
plot_pacf(power_consumption['Active_Energy'],lags=lag )
pyplot.savefig('PACF.jpg')
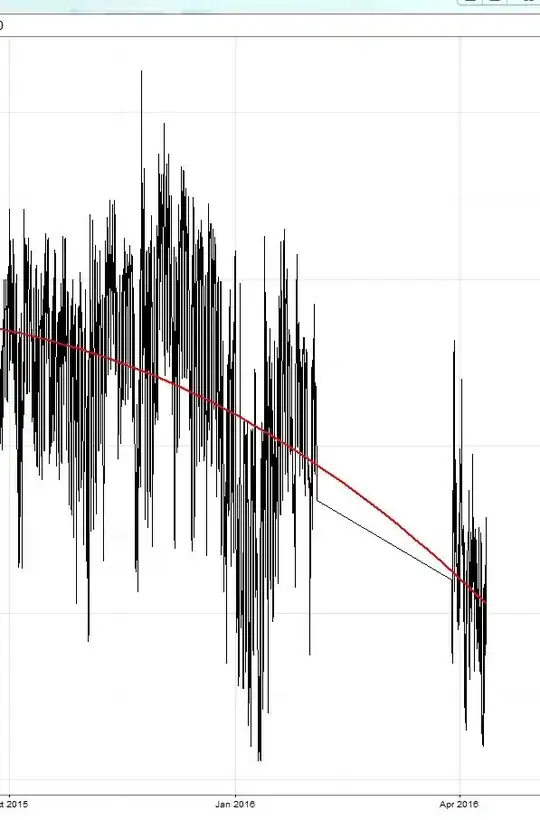
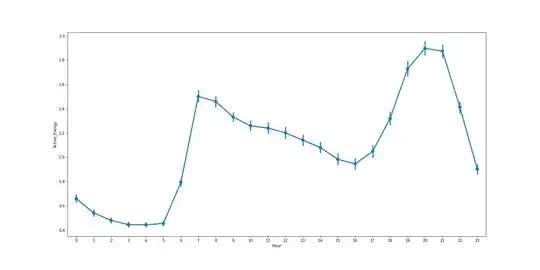
But as you can see ACF and PACF plots represent a seasonal behavior, which makes sense because during the data exploration I could see that the energy consumption has a seasonal pattern during the year and during the day. As it is shown in the plots below.
So my questions are the following:
Can the data be seasonal and stationary? It has been discussed here but I don't get it.
Is the data 'seasonal' enough, if that makes sense, to apply SARIMA or should I go for ARIMA?
If I should apply ARIMA, how can I tune the parameters p,d,q from the ACF and PCF?


