I have a longitudinal outcome of two time points(2018 and 2020), the outcome is a quality of life score generated from a validated instrument, the score ranges from -0.158 to 1, a value of 1 indicate perfect health state, a values of 0 indicate a health state equal to death, negative values indicate a health state worse than death.
I have a sample size of 457 longitudinal profile, the distribution of this outcome is heavily skewed to the left and multimodal, 55% of the scores lies in [0.8 ; 1 ]. 
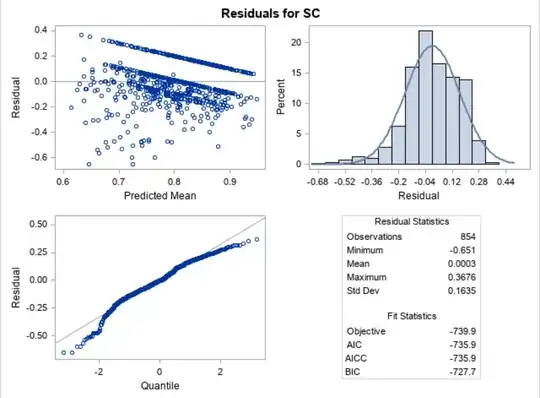
I tried the linear mixed model using some covariates such as age gender region, the plot of the residuals looked like this : 
It was clearly that the linear mixed model would not fit well, the log or square root transformations are not applicable since I have negative values, I tried this transformation :
- transform into scale of 0-1 by a normal linear transformation.
- apply the logit and transform to the whole real line.
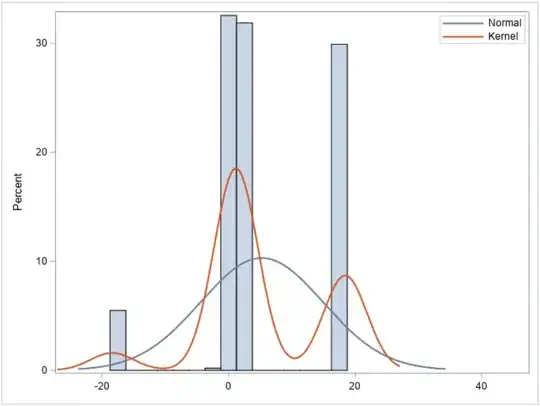
then the distribution looked like this

and when i fitted a linear mixed model the residuals were like this :
both raw variable and the transformed one are not suitable for modelling. How to handle this type of data?
A social preference valuations set for EQ-5D health states in Flanders, Belgium Irina Cleemput
