0

I'm able to fit a logistic growth curve, e.g. like this.

Example provided in that link:

data <- data.frame(
  x = 0:15,
  y = c(3.493, 5.282, 6.357, 9.201, 11.224, 12.964, 16.226, 18.137,
        19.590, 21.955, 22.862, 23.869, 24.243, 24.344, 24.919, 25.108)
)
model = nls(y ~ SSlogis(x, a, b, c), data = data)
plot(data$x, data$y)
lines(data$x, predict(model))

I wanted to experiment by trying to use this approach to model cohort lifetime revenue. I like this model because I get back:

  1. The asymptote which I'll report as almost predicted lifetime revenue
  2. The midpoint which is useful since it tells me how long it will take till we get half of the cohorts expected lifetime revenue.

But, fitting my actual data and plotting it, it looks like my data are more exponential than logistic growth. Black line is actual, blue is predicted with nls(cumulative_revenue ~ SSlogis(tenure, asym, mid, scale), data = mydata:

enter image description here

I like the properties of the logistic growth model, the asymptote and mid point. My question is: if my actual data appear to start off with steep growth before leveling off, is there an equivalent model for exponential growth, with a mid-point and asymptote?

Just eyeballing it I almost just want to flip it over for a hopefully better fit.

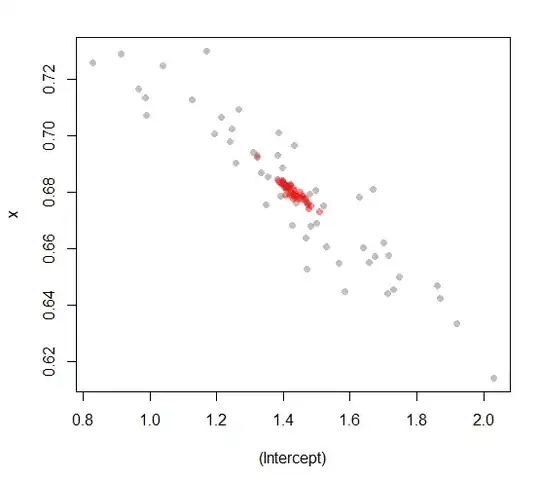
[Edit] Updated following a comment. I log transformed the predictor variable and now look! enter image description here
Doug Fir
  • 1,218
  • 1
  • 13
  • 27
  • Why not just use a log linear model? – Demetri Pananos Apr 26 '21 at 17:38
  • Hi @DemetriPananos, I liked the logistic growth because of the 2 coefficients: Asymptote and midpoint. I'm not sure but I don't think Log Linear provides those? – Doug Fir Apr 26 '21 at 17:39
  • Apologies, I meant logarithmic so something like `y~log(x)`. The logistic growth model tells a nice story, but it is very clear that the data do not support it. It seems like the second derivative of the processes is negative so if you somehow enforced the midpoint to be very small you might be able to get a reasonable fit. Are you able to share the data you used to make this plot? – Demetri Pananos Apr 26 '21 at 17:50
  • @DemetriPananos Yes! I'm going to share the new chart above with your simple suggested edit. It's beautiful! Editing my post – Doug Fir Apr 26 '21 at 17:55
  • Aw you killed it! Look at that fit! – Demetri Pananos Apr 26 '21 at 17:56
  • Thank you so much. Just so that I understand, (I'm learning this stuff), what have I done in English... I have transformed my logistic growth model into an exponential growth model but taking the log of the input variable. Correct? Of course if you would like to make your comment an answer I will accept it – Doug Fir Apr 26 '21 at 17:59

1 Answers1

1

The model isn't an exponential growth model (that was my mistake). In English, logarithmic changes in tenure will change $y$.

The model is $$ y = \beta_0 + \beta_1\log(x)$$

At tenure=0, the $y$ value is just $\beta_0$. When tenure is $\exp(1) \approx 2.72$, the $y$ value would be $\beta_0 + \beta_1 \log(\exp(1))$ which is $\beta_0 + \beta_1$. The tenure has to increase by a factor of 2.72 for an amount of $\beta_1$ to be added to the outcome. Make sense?

Demetri Pananos
  • 24,380
  • 1
  • 36
  • 94