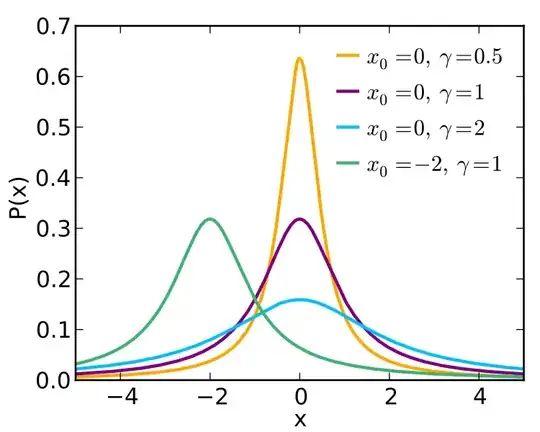
Whether or not something is an outlier depends upon the physics of the process that generates data. To see how this has meaning let us consider that some distributions naturally have heavy tails. For example the Cauchy distribution has tails so heavy that one cannot take a mean value and expect that as the number of realizations increases that the mean will converge to a stable value. In that case, one can find a median that will be stable, or use a truncated mean by leaving out a percentage, e.g., 22%, of the area under the distribution's tails. That latter process, leaving out samples does not signify that they are outliers, and if performed properly the truncated mean will converge for large numbers faster than the median.
There are other cases in which outliers are created because of imperfect measurement systems' data generation. To distinguish between measurement system problems and natural variability takes work. I would prefer not to call something an outlier unless I can identify some problem with the measurement system that can justify that claim. In other words, if I cannot say "This is an outlier because...." then I wouldn't. With the example of truncated means and the Cauchy distribution, some statistical parameters are not sensitive to truncation of data, others, like variance, would be sensitive to truncation of data.
For your data, I would suggest trying to fit multiple different distributions to see what distribution types they likely are. Some software implementations will automatically attempt to find the best distribution type, for example, the FindDistribution routine in the Mathematica language does that. It is my personal observation that when I use a better measurement system or more accurate model, the parameters tend to be more normally distributed.
Then, once one has identified what the distribution type is, one can calculate the probability of generating data values that are as extreme as the ones seen. Often, that probability is too large to expect that the values are outliers, but, I also occasionally find outliers that appear to be real because, for example, an assay becomes unstable at very low concentrations of the substance assayed. There are tests for outliers, e.g., see https://stats.stackexchange.com/a/28221/99274, but I wouldn't use the results without thinking in terms of cause and effect.
Now there is no blanket answer for clinical relevancy, it is generally an opinion. True enough, physicians tend to regard relevancy in absolute terms; yes/no. However, when such opinions are dissected they cease to be so. Consider for example this commentary on metformin dosing for dialysis patents: Comment on: “The pharmacokinetics of metformin in patients receiving intermittent haemodialysis” by Sinnappah et al. That represents a difference of peer reviewed expert clinical opinion concerning what is relevant to consider for dosing. So in general, what research can do is change what is considered to be clinically relevant. In your data, there may be more difficulty measuring whatever it is in the occipital and temporal regions, which might, for example, be expected on CT scanning in regions of thicker bone, but, you need to do some testing, and it never hurts to actually explain what you are doing.
