Definition
Suppose that $X \sim D(\mu, \sigma)$, where $D$ is a 1D distribution (generating from $\mathbb{R}$) with mean $\mu$ and stddev $\sigma$. If I sample $X$ (the random variable) $M\times N$ times, receiving a matrix $A$ (with $M$ rows and $N$ columns), then generate
a vector $V_\mu$ from $A$ by reducing each row of $A$ to a single value by calculating the mean of that row, and
a vector $V_\sigma$ from $A$ by reducing each row of $A$ to a single value by calculating the biased standard deviation of that row from the mean --> single number of $V_\sigma = \sqrt{\frac{1}{N}\sum_{i=0}^{N}(x_i - \overline{x})^2}$,
how do I properly estimate the original $\mu$ and $\sigma$ from $V_\mu$ and $V_\sigma$? It's clear that the estimate of $\mu$ is just the mean of $V_\mu$, but how do I handle the $\sigma$?
Sigma
I've tried experimenting, deciding that, for starters, let's assume that $D = \mathcal{N}$ and $X \sim \mathcal{N}(\mu=3, \sigma=5)$. I generated $A$, computed unbiased $\sigma(A)$ and then reduced $A$ to $V_\sigma$, from which I calculated the mean. This is the result:
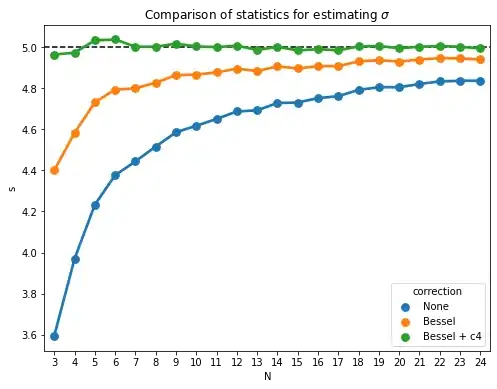
Obviously, the result is biased, the estimate undershoots the true $\sigma$ more often than not. If I instead multiply each member of $V_\sigma$ by $\frac{N}{N-1}$ before calculating the mean of $V_\sigma$, I get:
which overshoots the true $\sigma$ more often than not, so I'm really at a loss here. I've also tried multiplying $V_\sigma$ by $\frac{MN}{MN-1}$ instead, but this yields
which is slightly better than the original, but still heavily biased.
EDIT: Thanks to Ryan for pointing out my mistake, of course, I forgot to square root the correction factor. Still, I had no idea that the $c_4$ factor should be taken into account as well. By multiplying the mean of $V_\sigma$ by $\sqrt{\frac{N}{N-1}}$ and also by $1/c_4(M)$, I've obtained:
which is unbiased, but distributed more uniformly (with larger standard deviation).
Mu
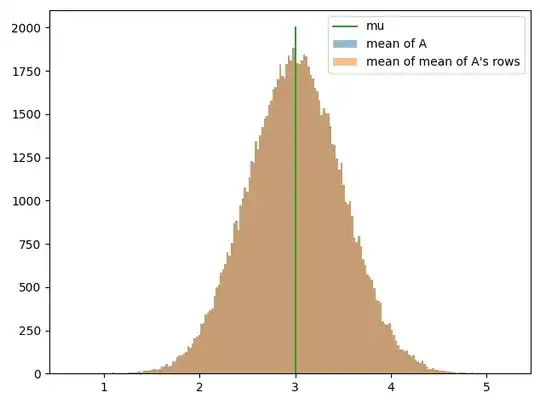
The mean estimate is good, as expected:
Question
After everything that I've shown, what I wonder is this:
Given $D = \mathcal{N}$, what are these distributions I'm observing? They look normal, but aren't they t? EDIT I know now that the distribution for mean estimate, if we subtract the true $\mu$, is a $t$ distribution with $N-1$ degrees of freedom.
SOLVED COMPLETELY Given $D = \mathcal{N}$, how do I correct the $\sigma$ estimate from $V_\sigma$? EDIT: answered by Ryan, see Sigma section.
Given $D = \mathcal{N}$, after I correct the $\sigma$ estimate, is it okay to claim that $D$ is probably $\mathcal{N}(\mu, \sigma)$? Certainly, the larger $M$ and $N$ get, the more confident I can be while claiming such a fact, right? What is the proper statistical procedure I should execute after I get my estimate of $\mu$ and $\sigma$? For example, according to my experiment, I can see that the $\mu$ estimate falls into $[2, 4]$ about 95% of the time. EDIT: I know now that if I generate the interval as $\overline{x} \pm 1.96 \cdot \sigma \cdot \sqrt{N}$, the interval will contain $\mu$ 95% of the time. But what about $\sigma$? And when I finally settle on some interval estimates of $\mu$ and $\sigma$, can something about $P(X > c), X \sim \mathcal{N}(...)$ be said?
Can this problem be solved for general $D$, that is, obtain $V_\mu$ and $V_\sigma$ from a bunch of samples ($M\times N$ to be specific) and conclude something about the true $\mu$ and $\sigma$?
