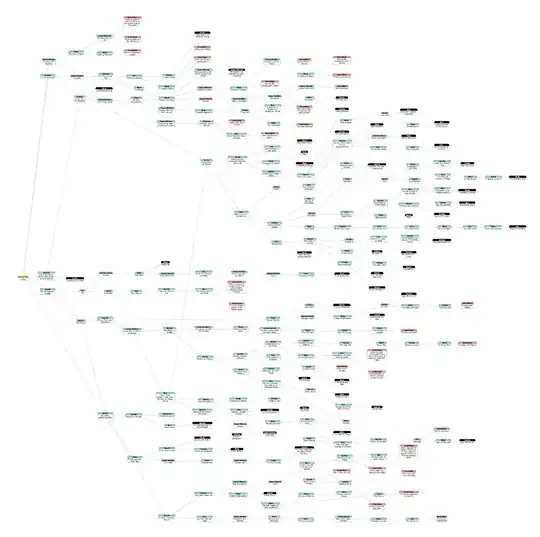
(This question compares a branching-fiction novel to a disease, bear with me.)
This is for fun, my friends and I are writing a branching-fiction novel:
A black node is a concluding chapter ("The End"), cyan is an existing chapter, and red is a chapter that needs to be written. When a red chapter is written in the future, it may or may not have multiple choices at the end. Data structure wise, it can be thought of like this:
        (
            [level] => 2
            [choices] => 0
            [conclusions] => 0
            [total] => 5
        )
In other words, there are five Chapter Twos, all of which are written, none of which are conclusions.
Hidden in all that confusion is one truth - since this is fiction with characters and plot, and since good stories have endings and dramatic shape, all threads will eventually die. Chapters early in the story are more likely to have choices, and just due to narrative momentum, chapters later in the story are more likely to have endings. It won't propagate forever.
I am trying to, given a graph's state, project the likely overall story size in terms of number of chapters.
This has proven to be really hard. :) I'm a programmer and while I love that it's pushing me in a math and stats direction, I'm a bit addled. It's not lost on me that this looks similar to a disease outbreak, and I've already started using projections based off of something akin to R0. I'm using various derivations of this equation:
       r^(t - 1) ( 1 - r^[n] )
S(n) =  ------------------
           ( 1 - r )
Where S(n) is total chapters, r is choices per chapter, t is starting level (1 in my case), and n is average thread length. So given that, I know that right now, my average "choices per non-concluding chapter" is 1.44, and my current normalized average thread length (if this were an evenly distributed graph) is 12.65 .
The problem is projecting forward; adding on the likely # of additional chapters from each red unwritten chapter. I obviously can't just move forward with 1.44 choices-per-chapter, because it'd go infinite. And it ignores that storylines are more likely to end as they grow in length. It's as if it's a disease where the virus has a greater probability of dying (independent of herd immunity and surrounding population) with each generation. Currently, my projection hacks the answer by saying "use 1.44 until you get to 12.65, and then assume each unwritten choice will only continue 1.5 chapters further". The 1.5 part is the hack from me thinking, "ok, going by the average, authors should wrap up the plot in the next 1-2 chapters." That projects a story size of 397 chapters (it's currently 229). But I'd like something more accurate.
It occurred to me that maybe I'm trying to estimate - from the graph - the probability that an unwritten chapter of a certain level n (like is it a Chapter 5 in the thread, or a Chapter 15) would turn out to be a conclusion when it is written. And that probability should increase as that thread's length increases.
But in the existing graph, that probability is not not monotonically increasing, so it occurred to me that maybe I could use linear regression. But my first try didn't work so well because the line of best fit wasn't anchored to 0/0. So it's possible that my question is "how can I do a linear regression when I know that f(x=0) should be 0, and f(x=n) should be 1, where n is unknown?" But I don't know if I'm barking up the wrong tree there.
I've also thought about measuring R0 at each generation - maybe this is just doing a linear regression that way, expecting a negative slope as it approaches 1 later in the story? The problem there is that as lines die out, the numbers get paltry. If there are two threads 15 chapters in length, and one of them happens to have two choices, I don't want that to throw the entire story projection out of whack. Perhaps I weight each generation by number of total chapters at that level?
Anyway, given all that, does anyone have any guidance on how I can more accurately project the overall story size from the partial graph, and convert it to code?
