2

I'm a PhD student in psycholinguistics and I'm having trouble in modeling some ordinal data. I have an ordinal response (completely disagree, disagree, neutral, agree, completely agree) and two categorical predictors (order: um-todo x todo-um; number: singular x plural). Initially, I tried to fit an ordered logit model (fitted with polr function in MASS package in R). For this model, I could extract predicted probabilities (using the predict() function) and plot these probabilities with ggplot2, using the code below:

# Make new data from the original one
novo<- data.frame(
  ordem = dados$Ordem,
  num = dados$Num
)

# Make the predictions
novo <-cbind(novo, predict(model, type = "probs"))

# Organize everything in a new table
lnovo<-melt(novo, id.vars = c("ordem", "num"),
            variable.name = "Respostas", value.name = "Probabilidade")

# Prepare some colors
paleta<-c("#D7191C", "#FDAE61", "#9C9C9C", "#ABDDA4", "#2B83BA")

# Reorder for the factor todo-um be in the base level
lnovo$ordem<-relevel(lnovo$ordem, ref = "todo-um")

# And then plot the graph
ggplot(lnovo, aes(x = num, y = Probabilidade, group=Respostas, colour = Respostas))+
  geom_line()+geom_point()+
  facet_grid(~ordem)+
  scale_y_continuous(breaks=seq(from = 0, to = 1, by = 0.1),
                     labels = scales::number_format(accuracy = 0.01))+
  scale_colour_manual(values=paleta,
                      labels=c("Discordo_Totalmente", "Discordo", "Neutro", "Concordo", "Concordo_Totalmente"))+
  labs(x = "Número da anáfora", y = "Probabilidades preditas", fill="Respostas")+
  ggtitle("Previsão de probabilidades estimada pelo modelo de regressão ordinal")+
  theme_classic()+
  guides(colour = guide_legend(reverse=T)) # Only to reorganize the legend.

And that's the result: enter image description here

Nonetheless, my data has two random factors (participants and items), so I chose to fit a mixed ordered model using the package brms. I could fit a lot of models, with distinct structures for the random factors. So, I tried to plot a graph as the one above, using this code:

# Make new data
pred<-data.frame(ordem = rep(c("todo-um", "um-todo"), 2),
                 num = c("PL", "SG", "SG", "PL"))

# Convert in factors
pred$ordem<-as.factor(pred$ordem)
pred$num<-as.factor(pred$num)

# Make predictions (95%)
pred<-cbind(pred, predict(m2, probs = c(0.025, 0.975)))
colnames(pred)<-c("ordem", "num", "1", "2", "3", "4", "5")

# Put table in a vertical format
pred<-melt(pred, id.vars = c("ordem", "num"),
           variable.name = "Respostas", value.name = "Probabilidade")

# Prepare colors
paleta<-c("#D7191C", "#FDAE61", "#9C9C9C", "#ABDDA4", "#2B83BA")

# Releval todo-um as base factor
pred$ordem<-relevel(pred$ordem, ref = "todo-um")

# Make the graph
ggplot(pred, aes(x = num, y = Probabilidade, group = Respostas, colour = Respostas))+
  geom_line()+geom_point()+
  facet_grid(~ordem)+
  scale_y_continuous(breaks = seq(from = 0, to = 1.0, by = 0.1),
                     labels = scales::number_format(accuracy = 0.01))+
  scale_colour_manual(values=paleta,
                      labels=c("Discordo_Totalmente", "Discordo", "Neutro", "Concordo", "Concordo_Totalmente"))+
  labs(x = "Número da anáfora", y = "Probabilidades preditas", fill="Respostas")+
  ggtitle("Previsão de probabilidades estimada pelo modelo de regressão ordinal")+
  theme_classic()+
  guides(colour = guide_legend(reverse=T)) # Apenas organizando a ordem da legenda.

But then, the result looked like this: enter image description here
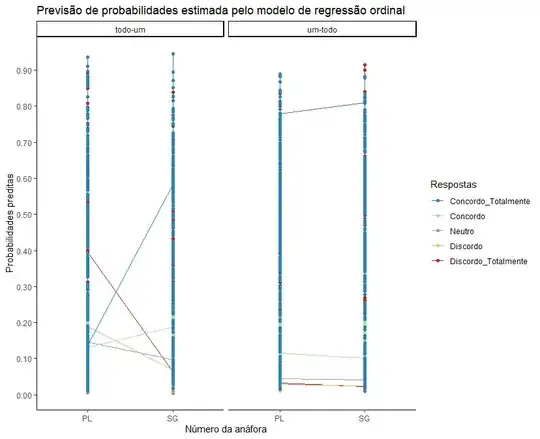
I've tried a lot of things, but I can't make this graph look like the other one. Even worse is the fact that I can't see any difference in the structure of the table of predicted values in both cases:

> str(lnovo)
'data.frame':   6360 obs. of  4 variables:
 $ ordem        : Factor w/ 2 levels "todo-um","um-todo": 1 1 2 2 2 2 1 2 2 1 ...
 $ num          : Factor w/ 2 levels "PL","SG": 1 2 1 2 2 1 1 1 2 1 ...
 $ Respostas    : Factor w/ 5 levels "1","2","3","4",..: 1 1 1 1 1 1 1 1 1 1 ...
 $ Probabilidade: num  0.502 0.1098 0.1643 0.0711 0.0711 ...
> str(pred)
'data.frame':   6360 obs. of  4 variables:
 $ ordem        : Factor w/ 2 levels "todo-um","um-todo": 1 2 1 2 1 2 1 2 1 2 ...
 $ num          : Factor w/ 2 levels "PL","SG": 1 2 2 1 1 2 2 1 1 2 ...
 $ Respostas    : Factor w/ 5 levels "1","2","3","4",..: 1 1 1 1 1 1 1 1 1 1 ...
 $ Probabilidade: num  0.3013 0.0232 0.0625 0.0275 0.0227 ...

Furthermore, here I've found a function plot_model() which gives me the graph below (plot_model(m, type = "pred", terms = c("Ordem", "Num")).

enter image description here

This is exactly what I want, but not in this format.
kjetil b halvorsen
  • 63,378
  • 26
  • 142
  • 467

1 Answers1

1

After some thinking and internet researching, I could finally create the graph I was looking for. From the same link above, where I got the plot_model function, I could get the get_model_data. Being so, I passed some parameters through this function, for instance, the credible level and the factors from the original data.

model_data<-get_model_data(m2,
               type = "pred",
               terms = c("Ordem", "Num"),
               ci.lvl = .95)

The result is an object from the ggeffects class, as the str function shows - str(model_data) - and the output is a little bit trickier to investigate and to plot (at least to my knowledge).

> str(model_data)
Classes ‘ggeffects’ and 'data.frame':   20 obs. of  7 variables:
 $ x             : num  1 1 1 1 1 1 1 1 1 1 ...
 $ predicted     : num  0.106 0.133 0.181 0.27 0.302 ...
 $ conf.low      : num  0.058 0.0835 0.1307 0.2245 0.1883 ...
 $ conf.high     : num  0.185 0.192 0.222 0.311 0.449 ...
 $ response.level: Ord.factor w/ 5 levels "1"<"2"<"3"<"4"<..: 1 2 3 4 5 1 2 3 4 5 ...
 $ group         : Factor w/ 2 levels "PL","SG": 1 1 1 1 1 2 2 2 2 2 ...
 $ group_col     : Factor w/ 2 levels "PL","SG": 1 1 1 1 1 2 2 2 2 2 ...

> head(model_data)
# Predicted probabilities of answer
# x = Ordem

# Response Level = 1
# Num = PL

x | Predicted | group_col |       95% CI
----------------------------------------
1 |      0.11 |        PL | [0.06, 0.19]

# Response Level = 2
# Num = PL

x | Predicted | group_col |       95% CI
----------------------------------------
1 |      0.13 |        PL | [0.08, 0.19]

Therefore, I decided to manually put these data in a "normal" data.frame:

model_data<-data.frame(ordem = model_data$x,
                       num = model_data$group,
                       Respostas = model_data$response.level,
                       Probabilidades = model_data$predicted,
                       lower = model_data$conf.low,
                       upper = model_data$conf.high)

Notice that the factor order is a numeric vector (1 or 2). After investigating the original output, I realized that 1 stands for um-todo, and 2 for todo-um. So I changed that vector in this fashion.

model_data$ordem<-c(rep("um-todo", 10), rep("todo-um", 10))

I've tried to do it using the mutate_if, from the dplyr package, but I couldn't.

Finally, I've transformed this character string in a factor:

model_data$ordem<-as.factor(model_data$ordem)

and, after all these steps, I finally could plot the graph the way I was trying to do, with and without credible intervals.

g1<-model_data %>%
  ggplot(aes(x=num, y=Probabilidades, group=Respostas, color=Respostas))+
  geom_line()+geom_point()+
  facet_wrap(~ordem)+
  scale_y_continuous(breaks = seq(from = 0, to = 1.0, by = 0.1),
                     labels = scales::number_format(accuracy = 0.01))+
  scale_colour_manual(values=paleta,
                      labels=c("Discordo_Totalmente", "Discordo", "Neutro", "Concordo", "Concordo_Totalmente"))+
  labs(x = "Número da anáfora", y = "Probabilidades preditas", fill="Respostas")+ 
  ggtitle("Previsão de probabilidades estimada pelo modelo de regressão ordinal")+ 
  theme_classic()+
  guides(colour = guide_legend(reverse=T)) # Apenas organizando a ordem da legenda.

g2<-model_data %>%
  ggplot(aes(x=num, y=Probabilidades, group=Respostas, color=Respostas))+
  geom_line(position = position_dodge(0.4))+geom_point(position = position_dodge(0.4))+
  geom_errorbar(aes(ymin=lower, ymax=upper),
                width=0.0, position = position_dodge(0.4))+
  facet_wrap(~ordem)+
  scale_y_continuous(breaks = seq(from = 0, to = 1.0, by = 0.1),
                     labels = scales::number_format(accuracy = 0.01))+
  scale_colour_manual(values=paleta,
                      labels=c("Discordo_Totalmente", "Discordo", "Neutro", "Concordo", "Concordo_Totalmente"))+
  labs(x = "Número da anáfora", y = "Probabilidades preditas", fill="Respostas")+ 
  ggtitle("Previsão de probabilidades estimada pelo modelo de regressão ordinal")+ 
  theme_classic()+
  guides(colour = guide_legend(reverse=T)) # Apenas organizando a ordem da legenda.

grid.arrange(g1, g2, ncol=1)

And that's the final result: enter image description here