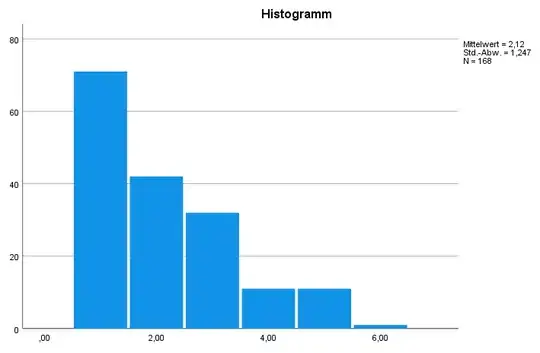
I would like to determine the distribution for the following data in order to explain it with a generalized linear model and further parameters:
A K-S test for Poisson distribution has already been made, but without success.
A log-normal distribution was also tested with this method: Tests for lognormal distribution
However also without success.
Which distribution is present here and how can I prove this? Is a GLM appropriate here or should this be tried via another model (like GEE or GLMM).
Side information: This is data from an emergency call service. The number of daily calls was sorted by date and written into a table. There is exactly one row per day. For each day the meteorological parameters of the considered area were added. (Only one specific area is considered). These are to explain with the help of GLMs the deviation of the number of calls from the expected value (this was determined for each day separately).
The values shown in the graph are the rounded deviation of the calls from the expected value (residuals).
I am grateful for any help
