1

I have large data (n = 12000) and I have to decide, is the PH assumption actually violated or this is just due to the high number of subjects.

                  chisq df         p
age              22.580  1 0.0000020
sex               0.073  1     0.787
comorbidity_long  3.814  1     0.051
GLOBAL           29.793  3 0.0000015

enter image description here

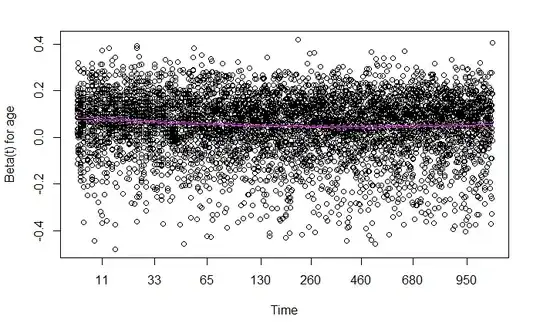
If there a point in trying to interpret the temporal changes and if they are clinically unimportant/marginal, I should not care about the PH assumption? On what scale the y-axis on this plot is and is it meaningfully interpretable?

st4co4
  • 1,499
  • 5
  • 10
  • The mean of the residuals should be approximately 0, so it is strange to have the purple curve entirely above 0. But, I think it is happening because the purple curve is the estimated median of the distribution as a function of time. The distribution is skewed in this case so the mean is different from the median. – John L Apr 03 '21 at 14:33

1 Answers1

3

You have a statistically significant violation of PH; The question about whether you have a practically important violation depends on your understanding of the underlying subject matter.

The smoothed curve shows how the estimated coefficient for age changes with survival time. To my eye, it looks like the estimates change from a bit under 0.1 per unit of age at early survival times to about 0.05 per unit of age at later survival times. Are those differences in the age coefficient over time large enough to matter for this study? Does this violation with respect to age matter in terms of the overall goal of the study, which presumably isn't in the effect of age per se? Only you and your colleagues can answer that, based on the subject matter.

Improper specification of the form of a continuous predictor can also lead to a PH violation; see this page for an example. With this number of cases, consider a flexible spline-based treatment of the age predictor, rather than the simple linear coefficient you currently use. Splines provide a flexible approach that allow the data themselves to tell you the proper functional form.
EdM
  • 57,766
  • 7
  • 66
  • 187
  • Can you explain more about how to interpret the plot? Should the scaled residuals be approximately normal with variance equal to $1/V_i$ and should the poster ignore the numbers on the y-axis or do they mean anything? The purple curve seems to be flat but it seems to have intercept greater than 0. What does the purple curve tell them? – John L Mar 10 '21 at 16:20
  • 1
    @JohnL the y-axis represents what coefficient estimates for `age` would be, based on different survival times along the x-axis. Individual residuals aren't so important in this plot (except for outliers); the smoothed trend in coefficient values over time matters. If PH holds that smoothed trend should be flat; it isn't quite flat here, dropping a bit at later survival times. See the documentation for the R [`survival` package](https://cran.r-project.org/package=survival) and its [time-dependent vignette](https://cran.r-project.org/web/packages/survival/vignettes/timedep.pdf) for more. – EdM Mar 10 '21 at 16:46