3

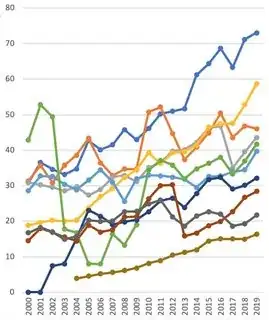
I have a data set of the revenues of 10 different large companies from the years 2000 through 2019. Here they are all plotted in one graph. The y-axis has a unit of billions of Euros:

                                                enter image description here

What I found interesting about this, is that the company with the brown revenue plot seems to have a very stable growth pattern. (This is the line with the least revenues in 2019; it consistently appears at the bottom from 2004 onwards.) In other words, the discrete function that maps the years to their corresponding revenues seems to be the least "rough" for the company with the brown colour.

We can formalize this idea of roughness by defining it as follows: for a vector $x$ containing the y-coordinates of the time series, the roughness $R$ is defined as

R = sd(diff(x))/abs(mean(diff(x))).

Here, sd denotes the standard deviation, diff comprises the vector of differences of the consecutive values of $x$, abs is the absolute value and the mean is the average.

Question: are there any statistical tests that allow one to compare the roughness of discrete functions with one another, and to conclude that one (set of) function(s) is indeed less or more rough than another (set of) function(s) ?
Max Muller
  • 81
  • 4
  • 1
    Two comments (one in disguise of a question): 1) For those who can't differentiate colours as well as others, please can you edit the picture and point out which line is the "brown revenue plot" explicitly? I assumed you were referring to the line that ends up the lowest at 2019. 2) I believe you will need to provide a definition/statistic of "roughness" before thinking what statistical tests could be applied. A possible definition could be looking at the inter-period change for each company, and its deviation from the _average_ change throughout the entire 19/20-year period. – B.Liu Jan 31 '21 at 14:38
  • @B.Liu Wrt comment 1): good point. I'll edit the post to point more clearly to the curve I'm thinking of. 2) Yes, a good definition of roughness would be welcome. Perhaps I need to come up with one myself, but I was hoping someone else could refer me to definitions of roughness that already appear in the literature, so I won't have to reinvent the wheel. – Max Muller Jan 31 '21 at 14:53
  • 1
    On reflection, you are probably right on [someone having defined "roughness"](https://stats.stackexchange.com/questions/24607/how-to-measure-smoothness-of-a-time-series-in-r). I don't think the question is an exact duplicate as you are ultimately asking a statistical test on the quantities proposed in the question linked above. – B.Liu Feb 01 '21 at 00:43
  • @MattF. Thank you for your suggestion! It seems like a good one, though I don't understand it completely yet. Should one compute the standard deviations or the variances of $\ln(X_{t}) - \ln(X_{t-1}) $ to get the volatility? And do you perhaps know of any educational resources (like articles or tutorials) in which one can learn more about performing statistical analyses on the volatility of time series? – Max Muller Apr 23 '21 at 11:24
  • @MattF. Alright, thank you! Final question: does the volatility need to be normalized as well? (Just like the roughness measure above). If so, how? – Max Muller Apr 23 '21 at 15:48
  • I turned my comments into an answer, so if you like you can make further comments and I can respond there. – Matt F. Apr 23 '21 at 17:01

1 Answers1

1

One standard measure of roughness is volatility. This arises from transforming each series $X_t$ into $\log(X_t)-\log(X_{t-1})$, and taking the standard deviations of the results.

(Ordinarily the standard deviations $\sigma$ need to be annualized. So if we start with daily stock prices from years with $252$ trading days, the volatility is $\sqrt{252}\sigma$; if we start with quarterly revenue data, the volatility is $2\sigma$. For the data here, we don't need to annualize, but the data may be too small for significance.)

Now we can interpret the question

  • Are two time series significantly different in roughness, as measured by volatility?

as

  • Are the standard deviations of the transformed series significantly different?

or equivalently

  • Are the variances of the transformed series significantly different?

We can answer this with an $F$-test, if the distribution of log-returns can be assumed normal, or with some of the other tests discussed at the same Wikipedia article.

As a side note: that lowest revenue line on the graph certainly looks less volatile than the others. Perhaps that company's revenue comes from long-term sales contracts, e.g. contracts signed in 2015 which determined a good amount of revenue for 2015-2019. In that case its revenue would look like an averaged version of the patterns from similar companies with shorter sales contracts.

Matt F.
  • 1,656
  • 4
  • 20
  • 1
    the problem with this approach imo is that it assumes that those deviations are independent, and since they come from a time-series, they are not, so the test will underestimate the sampling variability and be overly optimistic. – rep_ho Apr 23 '21 at 17:27
  • @MattF thank you! – Max Muller Apr 23 '21 at 21:05
  • @rep_ho interesting argument. Do you have any ideas on this question as well? – Max Muller Apr 23 '21 at 21:06
  • @MaxMuller Unfortunately not, sorry. I can only find problems, not solutions – rep_ho Apr 23 '21 at 22:14
  • @rep_ho Can you elaborate on “since they come from a time-series, they are not [independent]”? Do you mean that $\ln(X_2/X_1)$ has a dependence with $\ln(X_3/X_2)$ (another time) or with $\ln(Y_2/Y_1)$ (another company)? I think independence across times is reasonable (at least for firms with sales cycles shorter than a year), and I don’t think dependence across companies would matter much for this question. – Matt F. Apr 24 '21 at 02:52
  • @MattF. yes, exactly that. And smoother time-series will be more dependent on the previous timepoints than a less smooth time-series – rep_ho Apr 24 '21 at 07:21
  • @rep_ho, ok, if you can only find problems, I'll stop engaging. – Matt F. Apr 24 '21 at 08:49
  • @MaxMuller maybe try to estimate autocorrelation of the time series with their standard errors and use that for your inference. It's just an idea, and I don't know how to do it in practice, so I won't make it an answer. Good luck with your problem – rep_ho Apr 24 '21 at 11:09