I saw some similar questions, but none of them seems to address precisely the problem I am going to describe.
If someone can please point me in the right direction, it'd be great.
In our work, we run some regressions that are interpreted using this equation:
$P = \frac {10^{H \cdot LC}} {10^{H \cdot LC} + 10^{H \cdot X}}$
$P$ is measured for different values of $LC$, say 8 values equally spaced between $-11$ and $-4$, and constants $H$ and $X$ are fitted. [$H$ is always positive, $X$ can take any real value].
This is done for several different 'items' to test, and each gets its own $X$ and $H$.
In other (cheaper) experiments, $LC$ is fixed to, say, $-5$, and $P$ is measured.
This too is done for several different items, but as the experiment is cheaper, many more items can be processed.
Our goal is then to use the $P$ value from this single measurement to calculate $X$ for each item, assuming an 'average' value of $H$, which is indeed most of the time not far from $1$.
And here's where we face a problem.
The items we most care about are those for which $X$ is as low as possible (a value of $-9$ is considered quite good).
As you can see from the equation, this corresponds to items for which $P$ gets close to 1.
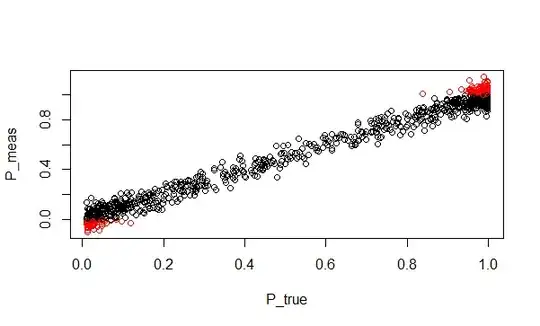
Given the way $P$ is measured, it is subject to a rather large uncertainty, to the point that, although theoretically it should always be $0 < P < 1$, its measured value can easily fall outside $(0,1)$, in particular at the high end of the scale, so it can get up to $1.1 - 1.2$.
This of course stops us from using the inverse equation:
$X = LC - \frac 1 H \cdot log_{10}( \frac P {1-P})$
which requires $P$ to be strictly in $(0,1)$.
How would you address this issue?
Do you know of any literature or posts I could consult?
For completeness, I will mention that in other cases where we measured values that were not supposed to exceed $1$, but did due to measurement error, we found from experimental repeats that the error was log-normally distributed, so we applied Bayesian concepts to calculate the expected 'true' value from the 'measured' value.
Given that the distribution of true values was bounded, this in a way 'shrank' the interval back to where it should be.
EDIT adding R code for clarity and exemplification
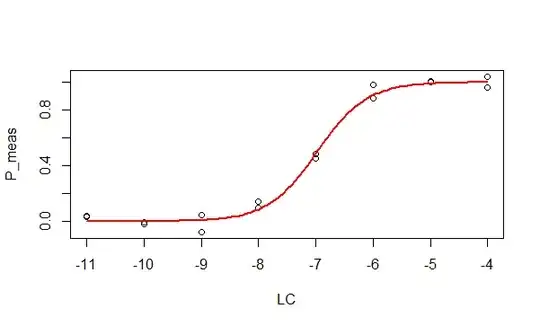
We have no problem regressing $P$ vs $LC$. E.g.:
    if (length(find.package(package="FME", quiet=TRUE))==0)
        install.packages("FME")
    require(FME)

    # 1. Regress P(LC)

    # Simulate data

    set.seed(012345)
    N <- 8
    X <- -7
    H <- 0.9
    LC <- rep((-11):(-4), each = 2)
    P_true <- 10^(H*LC)/(10^(H*LC) + 10^(H*X))
    P_meas <- rnorm(2*N, P_true, 0.05)
    plot(P_meas ~ LC)

    model.P.LC <- function(parms, LC) {
      with(as.list(parms), {
        10^(H*LC)/(10^(H*LC) + 10^(H*X))
      })
    }

    modelCost.P.LC <- function(p) {
      out <- model.P.LC(p, LC)
      P_meas - out
    }

    start.P.LC <- c("H" = 1, "X" = -6)
    fit.P.LC <- modFit(f = modelCost.P.LC, p = start.P.LC)

    curve(model.P.LC(fit.P.LC$par,x), min(LC), max(LC),
           col = 2, lwd = 2, add = TRUE)

    summary(fit.P.LC)

    #Parameters:
    #  Estimate Std. Error  t value Pr(>|t|)
    #H  1.00997    0.11060    9.131 2.84e-07 ***
    #X -6.98042    0.04689 -148.853  < 2e-16 ***
    #---
    #Signif. codes:  0 ‘***’ 0.001 ‘**’ 0.01 ‘*’ 0.05 ‘.’ 0.1 ‘ ’ 1
    #
    #Residual standard error: 0.04246 on 14 degrees of freedom
    #
    #Parameter correlation:
    #         H        X
    #H  1.00000 -0.01439
    #X -0.01439  1.00000
Suppose instead we have measured many values of $P$, each for a different 'item', from experiments at a fixed value of $LC$.
We assume $H = 1$, or some other suitable value, and we want to estimate $X$ for each item.
Well, we can't do that for all items, because for some of them the error on $P$ causes it to be outside $(0,1)$, so the formula does not work.
    # 2. Calculate X from P

    # Simulate data

    set.seed(012345)
    N <- 1000
    X_true <- runif(N, -9, -4)
    H <- 1
    LC <- -6
    P_true <- 10^(H*LC)/(10^(H*LC) + 10^(H*X_true))
    P_meas <- rnorm(N, P_true, 0.05)
    plot(P_meas ~ P_true, col = ifelse((P_meas > 0) &
        (P_meas < 1), "black", "red"))

    X_estimate <- LC - 1/H * log10(P_meas/(1-P_meas))
    plot(X_estimate[!is.nan(X_estimate)] ~
                     X_true[!is.nan(X_estimate)])
    abline(0, 1, col = "blue")
So I am wondering what a statistician would advise to do, to be able to 'use' the values of $P$ that do not fall within the allowed domain, in particular knowing that those close to $1$ are of particular interest to us, so we'd rather not throw away the data just because of some fluctuation in the signal.
Any practical suggestion is very welcome.


