Several related questions have been asked.
This one is similar, but it does not match this question exactly.
Also, i seem to have results that contradict the accepted answer there.
Data
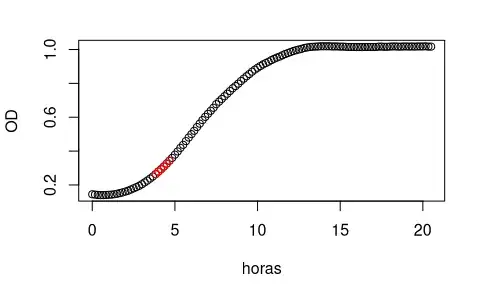
An imperfect growth curve (a time series).
Goal
Briefly, we take our not-quite-sigmoid growth curve, and try to find a linear region of maximum width and slope.
Ideally, we need a method that identifies regions that "significantly" fit a straight line (including zero-slope regions), and choose the one that has the maximum slope (and width).
Approach so far
Without a "score" for linear goodness-of-fit, we used sliding windows of size of 6 to scan the first and second derivatives of the data. The size 6 was chosen arbitrarily, seeing that our data was roughly linear in that time scale.
For the maximum slope region, we looked for the window with a maximum in the first derivative (which also coincided with a zero crossing in the second derivative, i.e. an inflection point).
For maximizing the width of the linear region (not sacrificing goodness-of-fit) we tried several approaches, and the best was the following:
- Take the initial 6-point window (defined previously by max in dx/dt), fit a linear model to it, and compute AIC.
- Extend the window to the right, by including the next observation along with previous data, and recompute the linear model and it's AIC.
- Repeat previous step until no more points are left in the series.
Method notes
- The AIC was calculated with R's
AIC(), giving itlm(log2OD ~ horas)as input. - We only extended the initial window to the right just for simplicity. How the window should "grow" seems to be a matter for another question.
- Since the points are always separated by 10 minutes,
indexis equivalent tohorasin the plots.
Results
By this method, the window of size 6 with maximum slope is highligted in red in the following plot:
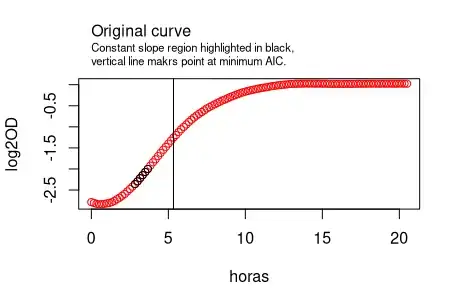
Next, we observed that the AIC value decreases as more points are added (by extending the window to the right), but only up to a point and then increases again. That AIC minimum is marked by a vertical black line.
In the following plot we show that the minimum AIC window corresponds to the time just before a transition between the exponential growth phase (linear at the middle), and the stationary phase (the plateau to the right).
Thoughts
I have read that AIC is used "only" to compare maximum-likelihood models with the same data. However it seems useful in this case. Explanations on why it may [not] be wrong to use it like this are welcome.
The answer posted here contradicts the results shown above.
I have also tried using: R2, Ljung-Box test, Durbin-Watson test, among others. But none of them have shown the rather useful behavior of the AIC. The former are monotone, and the latter has that interesting minimum.
Questions
- What is the best way to find linear regions in a curve? I have searched for alternatives and came across piece-wise linear models, or the "Chow test", though I am not familiar with them (nor with AIC really).
- Is there an appropriate goodness-of-fit way of finding linear regions of maximum span? (i.e. comparing models using different but overlapping spans of the time series).
- Why is there a minimum in AIC? According to a previous answer it's value should always increase when adding more points.
Thanks!


