1

I am trying to calculate the 95% confidence interval of the mean value of the population. I have this data:

[ 23.0, 70.0, 50.0, 53.0, 13.0, 33.0, 15.0, 40.0, 23.2, 19.0, 33.0,
  110.0, 13.0, 45.0, 53.0, 110.0, 53.0, 13.0, 10.0, 30.0, 13.0, 50.0,
  15.0, 20.0, 53.0, 15.0, 10.0, 10.0, 13.0, 13.0, 100.0, 13.0, 13.0,
  43.0, 30.0, 25.0, 18.0, 23.0, 23.0, 23.0, 13.0, 203.0, 30.0, 23.0,
  23.0, 43.0, 30.0, 53.0, 23.0, 13.0, 10.0, 20.0, 33.0, 13.0, 23.0,
  23.0, 12.0, 303.0, 55.0, 53.0, 23.0, 103.0, 45.0, 13.0 ]

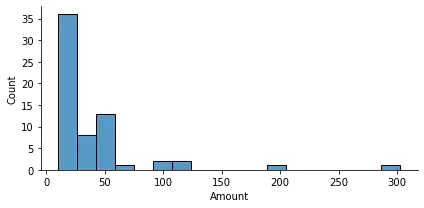
The distribution of which looks like this:

img

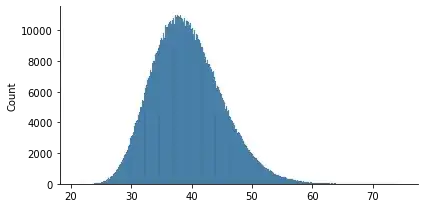
I tried to bootstrap resample this with 62 observations per sample but the means do not form a normal distribution. I thought with the central limit theorem the means would converge on a normal distribution the number of samples grew. But even with 1,000,000 samples the distribution is skewed right:

means = []

# resample 1,000,000 times
for i in range(100000):
    mean = resample(s).mean()
    means.append(mean)

Which gives me the following distribution of means:

img

ShapiroResult(statistic=0.9881454706192017, pvalue=0.0)

Indicates that we should reject the null hypothesis that the samples are drawn from a normal distribution.

Is there an assumption for the central limit theorem that I am missing? Why doesn't the means of these samples form a normal distribution?

I've read several posts on the central limit theorem and the bootstrap method but most deal with what should happen, not cases where it doesn't work.
Karolis Koncevičius
  • 4,282
  • 7
  • 30
  • 47
B. Bogart
  • 113
  • 3
  • 1
    If you fix a finite number over which you evaluate the means (62), and than go to infinite number of samples (1000000) the shapiro test will always detect slightly deviations from normality with high statistical significance, leading always to a small p value... I think – Thomas Jan 22 '21 at 20:14
  • Thomas, I thought that too. Shapiro isn't the best test here, but you can look at it and see that its not normal. – B. Bogart Jan 22 '21 at 20:15
  • Yes in this case also visually it is not. You have for sure deviations from normality caused by 62 being too small as Michael M says... – Thomas Jan 22 '21 at 20:18
  • Right, I forgot that samples need to be drawn from a 'large data sample'. That begs the question: how large is a large data sample? I can't seem to find any information on this. – B. Bogart Jan 22 '21 at 20:30
  • I do not think you need to be on the normality limit to use the bootstrap method . See e.g. https://stats.stackexchange.com/questions/202433/are-bootstrap-distributions-always-gaussian and maybe Michael M has also some more comments I think :) – Thomas Jan 22 '21 at 20:38

2 Answers2

1

The Central Limit Theorem is a large sample result. In your setting, 62 observations do not seem to be large enough for this.

The question is: why do you require anything to be normal? Or was it just for curiosity?

Michael M
  • 10,553
  • 5
  • 27
  • 43
  • The data is donation amounts at an event. I was trying to use the data to determine the 95% confidence interval of the donations mean to help a small nonprofit forecast donation amounts based on number attendees. I *think* I need a normal distribution to do that. – B. Bogart Jan 22 '21 at 20:21
  • I see. Why not add this piece of info to the original post? (The title suggested a problem about bootstrap.) – Michael M Jan 22 '21 at 20:43
  • This question is about why the central limit theorem didn't apply to my results while trying to use bootstrap - which has been answered. I'll probably end up posting another question with more details about what I am trying to achieve after I try a few more things. Thanks!! – B. Bogart Jan 23 '21 at 15:48
1

Central Limit Theorem applies to the number of observations, not number of repeated draws. You draw 62 observations - this is the number that has to tend to infinity for the theorem to apply.

To see why that is the case imagine that you are drawing 1 observation, instead of 62, and repeating it 100,000 times - would you expect this distribution to approach normal as your number of draws increases? Not at all - as your number of draws tends to infinity your distribution will match the original distribution of the real data.

Next think about drawing 2 observations. If you started with 62 data points, then there will be $62^2$ possibilities (each data point can be combined with one additional data point). And the distribution will be far from normal again.

You can also think about it this way: the distribution is determined by your data and the number of points used for taking the mean. 100,000 is just the number of times you take samples from this distribution. The number of draws taken from the distribution has no influence on its shape.

Karolis Koncevičius
  • 4,282
  • 7
  • 30
  • 47
  • That makes sense. I tested drawing samples of 5000 observations from my original sample and indeed the distribution of means is (usually) normal. 95% CI is 37.7-41.0. I wonder what that tells me. Is it that "If I take 5000 samples from the population I can expect the mean of those samples to fall in the range 37.7-40 95% of the time?" or can that be extrapolated to smaller samples (or any size samples) like "A sample drawn from the same population will have a mean between 37.7-40 95% of the time?" – B. Bogart Jan 23 '21 at 15:45
  • Neither, really :) You only have those 62 samples from the population, you don't know the population. Your confidence interval will shift if you did this procedure with a different set of 62 samples. You can say that the mean of the taken samples will be within the constructed confidence interval 95% of the time. Also, you can read the answers here about interpreting confidence intervals: https://stats.stackexchange.com/questions/505866/usefulness-of-the-confidence-interval/505989#505989 – Karolis Koncevičius Jan 24 '21 at 08:43
  • Got it. Thank you for the friendly help! – B. Bogart Jan 27 '21 at 03:15