This is a good question. You have to use a class of methods called Discrete Survival Analysis. There is excellent work by Fader and Hardie on this topic. Unlike the curve fitting methods, they use proabilistic methods to capture stochastic behaviors of customer retenton. The method they developed is called Beta Geometric where they use Geometric Distribution which is discrete cousin of exponential distribution with Beta Heterogeneity to project customer retention.
They also have extended their work to address memory less property of Geometric distribution with another technique called Beta Discrete Weibull. Both their work can be implemented in spreadsheet program such as Microsoft Excel. You can read their article on the approach as well as how to do it in Excel.
Gist of their approach is as follows:
Each Customer at the end of the month, flips a coin to decide to say or not to stay which can be characterized as a Bernoulli trial. There is a sequence of Bernoulli trial which can be characterized by Geometric distribution.
Each customer is different which can be characterized by Beta Distribution which captures heterogeneity of customers.
Paper cited above goes in depth and I would definitely recommend to read. They have developed maximum likelihood approach to estimate parameters based on discrete survival analysis. This class of model is also called Empirical Bayes methods (very similar to approaches like Beta Binomial.)
Fortunately, there is a R package called foretell Link here.
- I took your data, partitioned first 6 values, and projected the remaining 13 values.
- Applied both Beta Geometric and Beta Discrete Weibull.
- Plotted the data for visual comparison.
- Based on the actual vs predicted in the control period, both seems to be accurate, so I would use any one of the methods.
Both the methods do an amazing job of projecting retention all the way with just 6 values.
Here is code to replicate it, so if you want to use the below code you have to use the full sample and project it beyond 18 values.
The work shows the values of probabilistic modeling, with just 6 values you are able to project customer retention so successfully, the model predicts and fits the sample data like a glove!
retention <- scan()
1.00    0.92    0.91    0.90    0.88    0.87    0.86    0.85    0.85    0.84    0.84    0.84    0.83    0.83    0.83    0.82    0.82    0.82    0.82


retention_100 <- retention*100

    library(foretell)

    test <- retention_100[1:6]

    #beta Geometric
    bg <- BG(test,h = 13)

    #beta discrete Weibull
    bdw <- BdW(test,h = 13)

    plot(retention_100,type="b",ylim =c(60,100),ylab = "Retention %",xlab="Months")
    abline(v = 6)
    lines(c(bg$fitted,bg$projected),col="blue")
    lines(c(bdw$fitted,bdw$projected),col="red")
    legend(12, 70, legend=c("Actual", "Beta Geometric", "Beta Discrete Weibull"),
           col=c("black", "blue","red"), lty=1, cex=0.8,pch=c(1,NA,NA))

    text(4, 70,"Test")
    text(8,70,"Control")
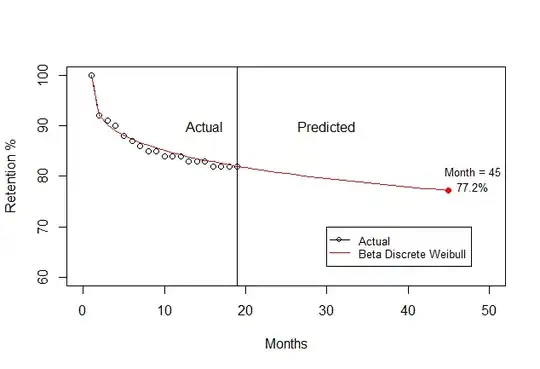
Using full data you can get the projected data at month 45.
At month 45, the retention rate ~77.2%. See below how to do it again an extension of previous code.
## Use full data and project retention upto 45 months using bet discrete weibull
#beta discrete Weibull
bdw_full <- BdW(retention_100,h = 26)

## Plot the data
plot(retention_100,type="b",ylim =c(60,100),xlim = c(0,50),ylab = "Retention %",xlab="Months")
abline(v = 19)
lines(c(bdw_full$fitted,bdw_full$projected),col="red")
## Value at 45
lines(45,c(bdw_full$fitted,bdw_full$projected)[45],col="red",pch=19,type="o")
text(48, 78,"77.2%",cex=0.8)
text(48, 81,"Month = 45",cex=0.8)


legend(30, 70, legend=c("Actual", "Beta Discrete Weibull"),
       col=c("black","red"), lty=1, cex=0.8,pch=c(1,NA))

text(15, 90,"Actual")
text(30,90,"Predicted")