0

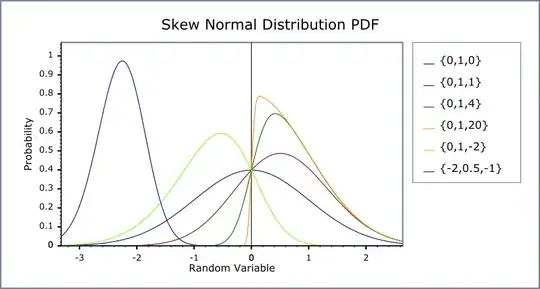
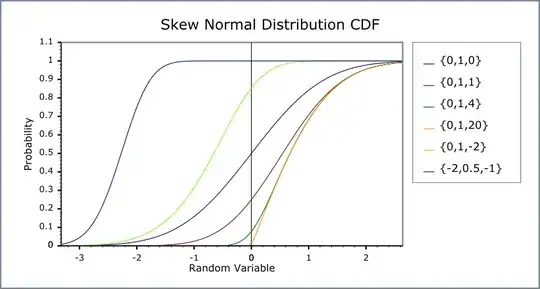
The following two figures are the pdf's of four parametric distributions and their corresponding cdf's. The most left-ward blue line is clearly not skewed, while the most right-ward orange line is positively skewed.

enter image description here

enter image description here

It is very easy to see which pdf's are positively skewed, but not so apparent in their corresponding cdf's. The blue and orange cdf's have virtually the same curvature. (Note that a dataset containing all negative values could still have a positive skew in its distribution, so the position of a distribution on the real-number line is not indicative of skewness whatsoever.)

Are there tell-tale signs from a cdf's plot, or underlying statistics (without knowing the parameters of how they were constructed of course), that are clear give-aways as to a cdf being positively skewed?
Source

develarist
  • 3,009
  • 8
  • 31
  • 3
    Surely, as you find by comparing cdfs below and above probability 0.5. Also as cdfs map one-to-one to pdfs, they preserve all information about distribution shape. , – Nick Cox Dec 05 '20 at 14:26
  • without reverting from the cdf back to the pdf though, the question is about observing the cdf only. "surely" what? – develarist Dec 05 '20 at 14:28
  • 2
    Start by thinking about simple cases. A uniform pdf maps to a linear cdf. Departures from uniformity mean convex and/or concave segments, and so on. Symmetric pdfs have implications too: start with what normal or logistic or Student's t distributions look like as cdfs. – Nick Cox Dec 05 '20 at 14:42
  • alright I see where you're going, but then the next part is comparing which of 2 cdf's is more skewed than the other based on their respective convex/concave segments – develarist Dec 05 '20 at 14:51
  • 2
    It's often hard to tell from pdfs which is more skewed, and that also depends on what you use to measure skewness. – Nick Cox Dec 05 '20 at 14:59
  • 2
    One way to evaluate skewness visually is to reflect the CDF (or the PDF, if you like) around a central location such as the median and overplot the two curves. – whuber Dec 05 '20 at 15:19
  • ok if the CDFs are overlayed on top of each other at a common central reference point, then is the more skewed CDF the one that vertically "out-grows" the other CDF more/first in the right-half of the graph, or is it the shorter one – develarist Dec 05 '20 at 15:23
  • 4
    It's not that simple: the graphs of the CDF $F(x) = \Pr(X\le x)$ and its reflection $G(x)=1-F(2m-x)$ (where $m$ is the median of $X$) may cross each other multiple times--even infinitely often. "Skewness," generally speaking, constitutes the myriad and various ways in which a variable's distribution may be asymmetric. A "skewness coefficient" is merely a numerical summary of asymmetry, and consequently is inadequate to express the full variety of possible asymmetries. See https://stats.stackexchange.com/questions/24853 for some interesting examples. – whuber Dec 05 '20 at 19:32

0 Answers0