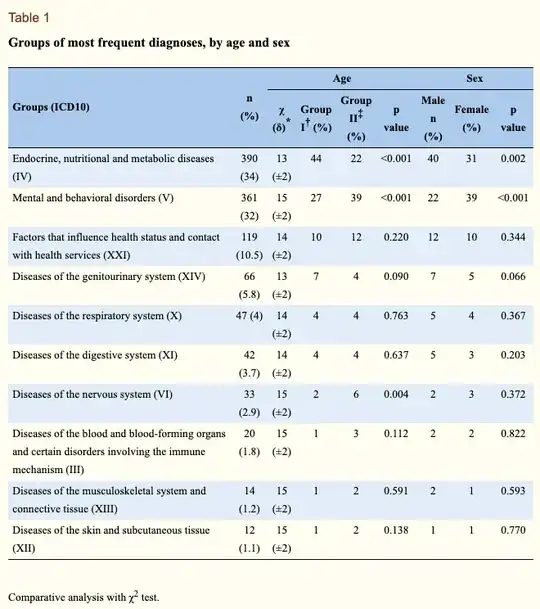
First of all, thank you for such a warm welcome to this forum. I am doing a study to see what diagnoses are the most common in a specific group (1) compared to another group (2). I want to show that there is a statistical difference in certain diagnoses between these two groups. I plan on doing this in SPSS but I don't know how I should arrange the data in order to perform the chi-2 test.
To clarify, the picture below is just an example of how it looks. Example: Patients in group 1 (column 2) in row A shows how many patients in group 1 that have received the diagnosis A. Patients in group 2 (column 3) in row C shows how many patients in group 2 that have received the diagnosis C.
Does anyone know if it is appropriate to do a chi-2 test here? Does anyone know how I should organize the data in order to perform it? I've been trying to follow instructions I do not get a result that looks alright.
I should add also that I have more than 200 different diagnoses but only 2 groups (as in the example). The two groups are also very different in size.
EDIT: I thought maybe I could do something like they did in this study and this specific table:

