2

Problem: I have a small bag of 166 fruits of which 62 are apples. I would like to know if my bag is enriched in apples.

Method: There is a big bag of 20,000 fruits

  1. I randomly sample 166 fruits from the big bag and count the number of apple
  2. I repeat this operation (random sampling of 166 fruits and count the number of apples) 100 times
  3. hypothesis $H_0$ = 'the average number of apples across sampling is equal or greater than 62' which means the small bag is not enriched in apples
    $H_1$ = 'the average number of apples across samplings is less than 62 ' which means the small bag is enriched in apples
  4. I performed one sample Z-test like below in Python:
    import pandas as pd
    from scipy import stats
    from statsmodels.stats import weightstats as stests
    
    df = pd.DataFrame({'Sample': {0: 1,
      1: 2,
      2: 3,
      3: 4,
      4: 5,
      5: 6,
      6: 7,
      7: 8,
      8: 9,
      9: 10,
      10: 11,
      11: 12,
      12: 13,
      13: 14,
      14: 15,
      15: 16,
      16: 17,
      17: 18,
      18: 19,
      19: 20,
      20: 21,
      21: 22,
      22: 23,
      23: 24,
      24: 25,
      25: 26,
      26: 27,
      27: 28,
      28: 29,
      29: 30,
      30: 31,
      31: 32,
      32: 33,
      33: 34,
      34: 35,
      35: 36,
      36: 37,
      37: 38,
      38: 39,
      39: 40,
      40: 41,
      41: 42,
      42: 43,
      43: 44,
      44: 45,
      45: 46,
      46: 47,
      47: 48,
      48: 49,
      49: 50,
      50: 51,
      51: 52,
      52: 53,
      53: 54,
      54: 55,
      55: 56,
      56: 57,
      57: 58,
      58: 59,
      59: 60,
      60: 61,
      61: 62,
      62: 63,
      63: 64,
      64: 65,
      65: 66,
      66: 67,
      67: 68,
      68: 69,
      69: 70,
      70: 71,
      71: 72,
      72: 73,
      73: 74,
      74: 75,
      75: 76,
      76: 77,
      77: 78,
      78: 79,
      79: 80,
      80: 81,
      81: 82,
      82: 83,
      83: 84,
      84: 85,
      85: 86,
      86: 87,
      87: 88,
      88: 89,
      89: 90,
      90: 91,
      91: 92,
      92: 93,
      93: 94,
      94: 95,
      95: 96,
      96: 97,
      97: 98,
      98: 99,
      99: 100},
     'nb_apples': {0: 79,
      1: 65,
      2: 74,
      3: 77,
      4: 80,
      5: 68,
      6: 78,
      7: 70,
      8: 93,
      9: 80,
      10: 69,
      11: 71,
      12: 87,
      13: 75,
      14: 80,
      15: 79,
      16: 71,
      17: 78,
      18: 83,
      19: 73,
      20: 78,
      21: 76,
      22: 66,
      23: 73,
      24: 73,
      25: 84,
      26: 77,
      27: 69,
      28: 85,
      29: 79,
      30: 77,
      31: 76,
      32: 75,
      33: 77,
      34: 75,
      35: 75,
      36: 68,
      37: 87,
      38: 79,
      39: 62,
      40: 79,
      41: 84,
      42: 78,
      43: 71,
      44: 74,
      45: 78,
      46: 62,
      47: 77,
      48: 77,
      49: 66,
      50: 80,
      51: 76,
      52: 88,
      53: 65,
      54: 86,
      55: 81,
      56: 78,
      57: 81,
      58: 75,
      59: 86,
      60: 84,
      61: 79,
      62: 67,
      63: 74,
      64: 70,
      65: 76,
      66: 67,
      67: 90,
      68: 78,
      69: 71,
      70: 64,
      71: 86,
      72: 79,
      73: 77,
      74: 69,
      75: 68,
      76: 71,
      77: 71,
      78: 79,
      79: 78,
      80: 72,
      81: 81,
      82: 78,
      83: 84,
      84: 73,
      85: 83,
      86: 78,
      87: 72,
      88: 79,
      89: 78,
      90: 82,
      91: 76,
      92: 70,
      93: 77,
      94: 77,
      95: 71,
      96: 70,
      97: 62,
      98: 76,
      99: 87}})
    #Preforming the Z-test
    nb_appleInsmallBag = 62
    ztest,pval = stests.ztest(df['nb_apples'], x2=None, value=nb_appleInsmallBag)
    
    print(f"average number of apples across samplings {df['nb_apples'].mean()}")
    print(f'number of apple in my small bag {nb_appleInsmallBag}')
    print(f'p-value: {pval}')
    if pval <0.05:
        print('Reject Ho')
    else:
        print('Accept Ho')

Here is the results:

average number of apples across samplings 76.07
number of apple in my small bag 62
p-value: 1.3457688075004756e-105
Reject Ho

I'm rejecting $H_0$. However the average number of apples across samplings (=76.07) is greater than 62, meanings that my small bag is clearly not enriched in apples. I'm confused and I'm wondering how to formulate the null hypothesis and which statistical test is the most appropriate to my problem.
Thank you in advance for shedding light on it for me.
Stochastic
  • 799
  • 1
  • 6
  • 28
Amilovsky
  • 23
  • 3
  • Since you are able to sample the large bag, you *know* its contents: that is what $H_0$ should be. The question you want to answer is the frequency with which a random selection of 166 fruits from the large bag contains 62 or fewer apples. The results are explicit about that: what then, do you find confusing? Perhaps reading some of the answers at https://stats.stackexchange.com/questions/31 will help you out. – whuber Nov 09 '20 at 21:30

1 Answers1

2

From your simulation, it seems your small bag doesn't have a larger proportion of apples than the large bag (which you're taking as a 'standard').

However, you to find evidence in your simulation that the small bag has a smaller proportion of apples. Certainly, your initial concern that the small bag is "enriched" in apples is not relevant. So if "enrichment" is your real concern, then you're done.

By contrast, if your real concern is whether the small bag has an equitable proportion of applies, then there is something to discuss. From the point of view of hypothesis testing, the issue is whether your alternative is one or two sided.

I'm a great fan of simulation, but sometimes simulation results can be confusing if you don't have a foundational knowledge about probability distributions and testing. So I will show some facts about binomial distributions.

Suppose you have a large population (of size $N=20,000)$ of different kinds of fruit in which the proportion of apples claimed to be $p_A = 0.76 = 76\%$ and you're trying to sample from the population $n = 166$ pieces of fruit from the population at random. You will use these $n$ pieces to test the null hypothesis $H_0: p_A = 0.76$ against the alternative hypothesis $H_a: p_A \ne 0.76.$

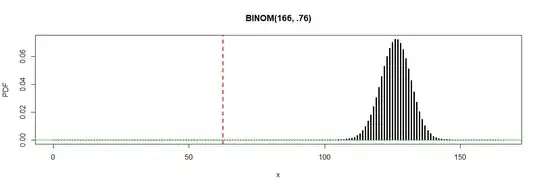
Roughly speaking, if $H_0$ is true, then you should get around $np_A = 166(.76) \approx 126$ apples in your sample. Somewhat more precisely the number $X$ of apples in your sample should have $X \sim \mathsf{Binom}(n=166, p=0.76).$ Here is a graph of probabilities in that distribution. (R code below.)

enter image description here

If you see only $X = 76$ apples in your sample, that is an extremely unlikely outcome (vertical dotted line), if the population is as described in the null hypothesis. The probability of $P(X \le 76) \approx 0$ and the probability of getting that many more then the expected number of apples is $0$ (completely impossible).

So, if the population is as described in the null hypothesis it is almost impossible to get the results in our sample of size $n = 166.$ We choose to believe the null hypothesis is false.

x=0:166;  PDF = dbinom(x, 166, .76)
plot(x, PDF, type="h", lwd=3, main="BINOM(166, .76)")
 abline(h = 0, col="green2")
 abline(v = 62.5, col="red", lwd=2, lty="dashed")

pbinom(62, 166, .76)
[1] 4.843906e-26

Your simulation can be viewed as an alternative way of showing that it is extremely rare to get only 62 apples in 166 draws from the hypothetical population. One way to do such a simulation in R is shown below (but with 1000 replications instead of 100):

set.seed(2020)
nr.apples = rhyper(1000, 15200, 20000-15200, 166)
summary(nr.apples)
   Min. 1st Qu.  Median    Mean 3rd Qu.    Max. 
  109.0   122.0   126.0   126.2   130.0   144.0 
mean(nr.apples <= 62)
[1] 0

Note: Strictly speaking if we sample $n=166$ pieces of fruit without replacement from among $N = 20,000,$ we should might have used a hypergeometric distribution instead of a binomial one. But when the sample size is less than 10% of the population size, the difference between sampling with and without replacement is negligible.

BruceET
  • 47,896
  • 2
  • 28
  • 76