2

I have some questions.

In a linear model, I want to force intercept to zero.

The program (I used JMP) does not provide R-squared when intercept becomes zero.

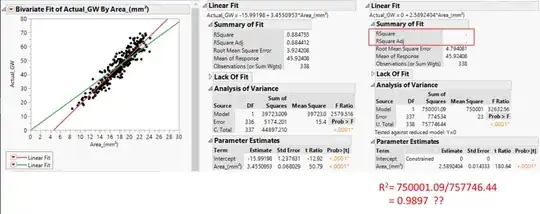
enter image description here

So, I calculated R-squared by myself by given SSR/SST in the program. The R-squared was higher than before forcing to zero.

  1. Is this possible? Because linear fitting is based on minimizing error, so if I change it artificially, I think R-squared should be decreased. Also, the linear line (Green line) for intercept 0 on the graph, seems not to have 99% R-squared.

  2. If this R-squared is not correct, how can I calculate R-squared when forcing intercept to zero?

Many thanks,
Jinwook Kim
  • 123
  • 6
  • 1
    R square might not make much sense when intercept is zero. For R, they would calculate SST differently, https://stats.stackexchange.com/questions/26176/removal-of-statistically-significant-intercept-term-increases-r2-in-linear-mo. Not very sure how they do it in jmp – StupidWolf Nov 05 '20 at 16:27
  • 2
    This question is answered in https://stats.stackexchange.com/questions/267325/why-does-statsmodels-api-ols-over-report-the-r-squared-value/267329#267329, although the focus there is on `statsmodels` in Python rather than on JMP. In the present case, different definitions of SSR & SST are used when the intercept is omitted. This is directly analogous to what I wrote in that previous answer about using a different definition of R^2 when the intercept is omitted – Jake Westfall Nov 05 '20 at 16:29

2 Answers2

4
  1. You are correct that imposing the constraint of setting the intercept to zero can only decrease the quality of the fit.

  2. Your calculation is correct. In the general Coefficient of Determination sense, $R^2$ is the fraction of total variance that is explained by the model.

I notice a couple of things in the Analysis of Variance section of the second model. The total sum of squares is larger than in the first model, and there is note saying, "Tested against reduced model: Y=0". The usual practice is to test against $Y=\bar Y$, i.e, model all Y values as being equal to the mean rather than depending on X. Setting the Y=0 inflates the total residual error and which allows the model to look like its doing more than it would be doing with $Y=\bar Y$.

The two $R^2$ values aren't comparable because they are computed against different null models. The red line is clearly the better fit.

edit: you can get around the inflated total sum of squares and calculate $R^2$ for the second model using the Error Sum of Squares. The second model has 7745 vs. the 5174 of the first model. The total sum of squares is given in the first model as 44897. That gives $R^2$ for the second model as $1 - ESS / TSS = 1 - 7745 / 44897 = .827$

abstrusiosity
  • 876
  • 1
  • 11
  • Thank you so much. Your answer is what I want to know exactly. I calculated SST, SSR, SSE by hands when forcing intercept to zero. Generally, SST is calculated by yi - ȳ and SSR is calculated by ŷi- ȳ, but when intercept is 0, SST was just the sum of square of yi and SSR was just the sum of square ŷi. The R2 you suggested to calculate is exactly the same as what I got it from the Excel graph (As I don't trust Excel, I was suspicious about the R2 value which Excel generated on the graph). Many thanks!!! You're my hero!! – Jinwook Kim Nov 05 '20 at 17:49
2

There are multiple ways to calculate $R^2$. If you don't have an intercept in your model, the different methods can give different results.

You have calculated it using the sums of squares. What's the model sum of squares in your case? It's calculated using a model with no parameters. It's the sum of the squared values of Y. The larger the values of Y, the larger your sum of squares will be, and the larger your $R^2$ will be. Try adding or subtracting a constant from Y (or from X). In a regression with an intercept, your $R^2$ will be unchanged. In a regression model without an intercept, your value of$R^2$ will change dramatically.

But $R$ can also be defined as the correlation between the predicted values of Y and Y. If you calculate it this way (and square it, if you want $R^2$) you will get the same value when you add a constant.

I guess the question is: Why do you want $R^2$? What do you want $R^2$ to mean? Then you can decide how to calculate it.

Jeremy Miles
  • 13,917
  • 6
  • 30
  • 64
  • Thank you for your answer!! The sum of the squared of the total, SST is the sum of square of y, and the sum of square due to regression, SSR is the sum of squared of ŷ, isn't it? That's why the value of SST and SSR is increased a lot? – Jinwook Kim Nov 05 '20 at 18:04
  • Ah!! forgot to answer what you asked. I'm making a model to predict grain weight from the area, but if I include the intercept when the area becomes small at a certain point, grain weight becomes minus which is impossible. So I want to remove the intercept to provide only positive predicted values. So I wanna check if I remove the intercept how R^2 is changed to check our linear model is well fitted or not. So do you think I should calculate R^2 in this case? – Jinwook Kim Nov 05 '20 at 18:18