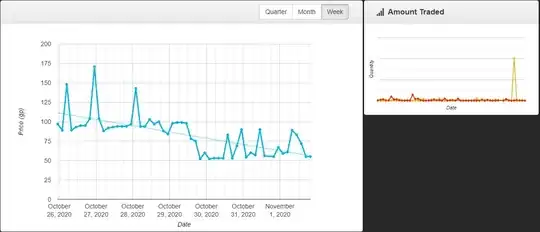
I am currently working on a personal project where I am trying to analyse a small mmorpg marketplace. I have access to the average price and the quality moved for every item, every three hours (going back about 5 days), and some data points for every day, and every 3 days (for a more historical perspective).
My problem, is how to turn this data into something representing the variability (aka profitability) and possibly safeness of investment. For example, an item that is and has been price X +/- half a percent for the last month, it is an extremely safe investment, but completely non-profitable.
There are no listing fees, taxes, or anything like that, so we can just treat is like a theoretically perfect stock market.
I want to keep it very simple and mathematical. I don't want to be considering human patterns, and I don't think I want to keep adding to this data, just scrap the mentioned data and go with that.
None of the stats classes I ever took, that I remember, ever covered anything like this. So I am not even sure what language to use to google search this, but common sense, I am pretty sure the analysis should be based on discovering the variability of the price data, and the frequency of this variability. But it seems like it should also look at if there is a positive or negative trend of the data; And it would be like it might be possible to do some safeness analysis. To predict how likely the price is to fall even more.
My problem solving this analysis is two fold. I am to even familiar with investment theory at all to what to look for necessarily. So I am sort of hoping there might be some standard pre-build algorithms that I already know how to analysis this type of data. This seems like it should be a solved problem, but maybe all the solutions are trade secrets.
