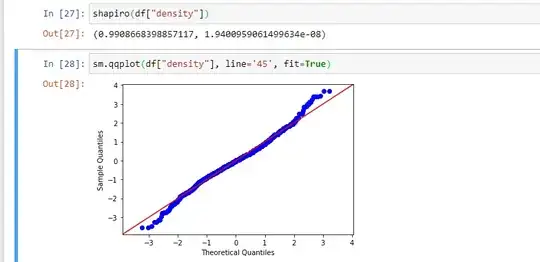
I have a problem comparing results from shapiro test and qqplot. Shapiro tells me my data doesn't have normal distribution characteristics (pvalue = 1.94...e-08 <= 0.05) however when I look on QQ plot the points are pretty close to the reference line.
How should I interpret that?
I'm using shapiro function from: https://docs.scipy.org/doc/scipy/reference/generated/scipy.stats.shapiro.html

