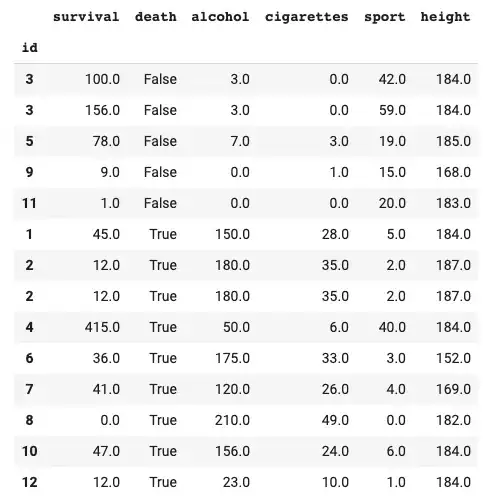
Your specific result has little to do with Cox regression itself but a lot to do with regression in general, when predictors are correlated. As @chl notes, in your data (and also in real life) smoking behavior and alcohol intake are highly correlated.
A search on this site for "correlated predictor" just turned up 2500 hits. This is a very common situation. In addition to the post that @chl linked to in a comment, you might want to look at this thread on how adding predictors can make a previously "significant" predictor seem to become "insignificant," or this thread about apparently opposite behavior when predictors are added to a model.
There are a few issues potentially at play here. For one, sometimes the true effect of a predictor is only seen when other predictors associated with outcome are taken into account. For another (maybe more relevant in your case), if two predictors are highly correlated with each other and with outcome, a regression model won't know which of them to give "credit" for and will effectively choose the one that fits best in your data set, or alternatively deem both "insignificant" in some cases if they are too highly related. For a third possibility, remember that a linear regression model can be thought of similarly to a Taylor expansion of a function, limited to only the first-order terms in your example. Sometimes with correlated predictors, one of them might get too much credit based on its linear approximation, and a coefficient of opposite sign for the other might be providing some correction for that over-estimation.
As your question was about Cox regression, note that this is even a bigger problem there than for standard linear regression. In standard linear regression, the types of problems noted above arise when you omit from a model a predictor that is both associated with outcome and with included predictors. In Cox regression, like in logistic regression, you can bias results even if an outcome-related predictor isn't at all correlated with the included predictors.


