4

I'm working on a problem where I need to calculate the median for a very large data set (for instance, 100M values) that has a log-normal distribution. Because of the data set's size, we were thinking about taking a sample (say, a random subset of 2000 values), and calculating its median. While this is much nicer from a computation perspective, I am very worried it will be inaccurate.

What method could I use to determine how accurate this sampled median is?
amphibient
  • 133
  • 7
septagram
  • 165
  • 4
  • You can obtain the median using an [online algorithm](http://stats.stackexchange.com/questions/346/what-is-a-good-algorithm-for-estimating-the-median-of-a-huge-read-once-data-set). If that's not good enough, search our site for [additional approaches](http://stats.stackexchange.com/search?q=%2Bmedian+%2Bonline). Note that finding a median is a $O(N)$ algorithm and typically all the data need to be read at most twice, so $10^8$ is scarcely large: the median can be computed reliably in the amount of time it takes to read the data. – whuber Jan 30 '13 at 22:19

3 Answers3

6

Just an empirical answer, I am sure someone else will be able to give you a more formal one.

set.seed(12345)

# Generate a big dataset, log-normally distributed
bigdata <- rlnorm(10e6, meanlog=log(25))

# Now generate 500 different samples with 
# 10, 100, 1000, or 10000 elements in it
# and compare the medians

nelem <- c(10, 100, 1000, 10000)

m <- matrix(NA, nrow=1000, ncol=length(nelem))
par(mfrow=c(2,2))

for (el in 1:length(nelem))
  {
  for (i in 1:500)
    {
    data <- sample(bigdata, nelem[el], replace=F)
    m[i, el] <- median(data)
    }

  # Plot the histogram
  hist(m, 100, col="black", freq=F, las=1, 
       main=paste(nelem[el],"element sampled"), xlab="Median")
  # Plot the "real" median
  abline(v=median(bigdata), col="red", lwd=2)
  }

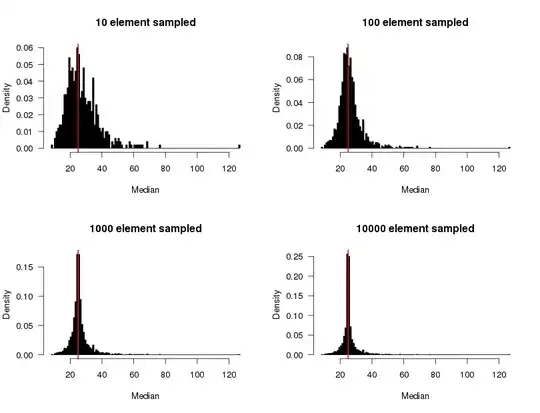
This gives you the distribution of the medians from 500 trials of sampling:

median histograms

As you can see, you get fairly good results already by sampling 1000 elements of the 10M from the original data.

nico
  • 4,246
  • 3
  • 28
  • 42
  • +1 to @nico for providing a fully working empirical way to test different options. A very pragmatic way to test approaches, esp with the kind of tools most of us have at our disposal (R). I think the OP wants a confidence interval for his estimate of the median. – Ram Jan 30 '13 at 22:10
3

You could repeat the sampling process many times and calculate the confidence interval. This will give you an estimate where e.g. 95% of your sample medians fall.

user12719
  • 1,009
  • 1
  • 8
  • 10
1

Besides empirical answers, there are large sample ones:

If $f_0$ is the density (i.e. assuming a continuous variable) at the median then the variance of the median is asymptotically $\frac{1}{4nf_0^2}$

e.g. see http://en.wikipedia.org/wiki/Median#Variance

Glen_b
  • 257,508
  • 32
  • 553
  • 939