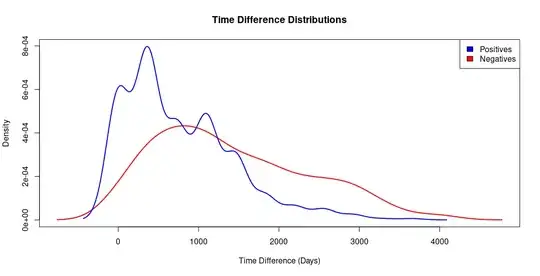
I have built a graph where each vertex has an associated time point and the edges between vertices are weighted by a pairwise distance measurement ("distance" is a small percentage, typically between 4-6%). These edges also have a time difference: the difference in time point between the two vertices they connect. I've been applying filters to the list of edges such that edges with a distance below a threshold (ie. 1%), are marked positive, and edges above that threshold are marked negatives. I'm interested in a threshold of 1.5% where the group of positives has a significantly lower mean time difference than the group of negatives.
However, positives become extremely rare events below a filter of about 2%. With a 1.5% filter, ~ 500 out of ~ the 1.2 million edges are positive, meaning that for 99% of the data set, time difference appears meaningless. I was hoping to fit a simple logistic regression in R:
glm(Positive ~ TimeDifference, df, family = 'binomial')
... but it's looking like that's the wrong approach. I'm getting a tiny coefficient on Time Difference, even when I downsample the negatives to be approximately the same size as the positives. Is this simply a situation with little to no association? or is there some model adjustment that can allow me to better represent the increased odds that positive edges have a low time difference? It would be great if I could get an equivalent to the odds ratio offered by a logistic model.
