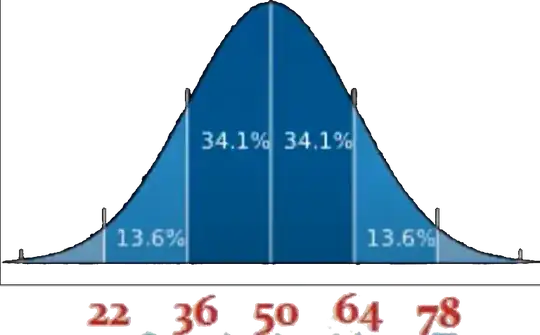
On a normal distribution curve, standard deviation tells us how much data fall in each group around the mean, according to empirical law.
So, for example of SD = 14 and sample mean($\bar{x}$) = 50, as shown in figure below:
 If the data is normally distributed, 68.2% of the data will be around the mean inside SD units on each side to mean.
Real data is hardly normally distributed, so how do I interpret Standard Deviation values I get from software, for example, numpy.std of Python?