17

What is the best programmatic way for determining whether two predictor variables are linearly or non-linearly or not even related, maybe using any of the packages scipy/statsmodels or anything else in python.

I know about the ways like plotting and manually checking. But I am looking for some other programmatic technique that is almost certain to differentiate whether a bivariate plot would be linear or non-linear or no relationship between them in nature.

I hear about the concept of KL divergence somewhere. Not really sure of the concept and in-depth, and whether can it really be applied for this sort of problem.

ShyamSundar R
  • 293
  • 1
  • 8
  • 4
    Even the helpful answers so far seem to assume, or to focus on, an idea of relationship meaning a single-valued relation between variables with noise as extra. . A simple counter-example is points in a circle on a scatter plot, which might or might not qualify as a relationship. – Nick Cox Sep 08 '20 at 13:28
  • 1
    For what purpose do you need to programmatically determine determine if two variables are linearly related? As the posters have said, there isn't necessarily a single programmatic way, but in certain contexts/uses, there may be a good way. – roundsquare Sep 08 '20 at 13:37
  • 1
    distance correlation can also detect noisy circles. see Cliff AB answer for nonlinear correlation measures – Josef Sep 13 '20 at 17:56

4 Answers4

25

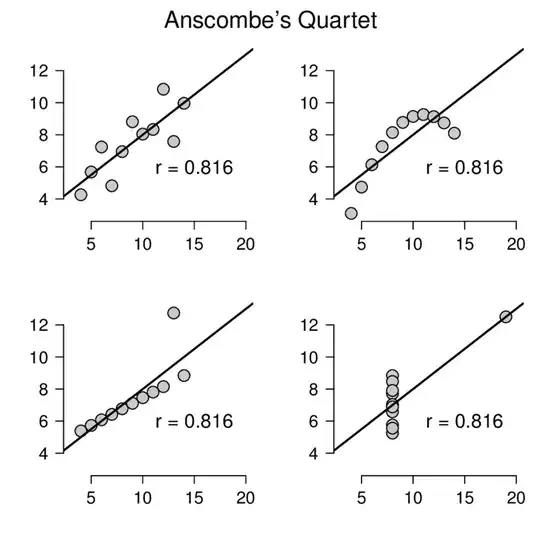
It is very difficult to achieve what you want programmatically because there are so many different forms of nonlinear associations. Even looking at correlation or regression coefficients will not really help. It is always good to refer back to Anscombe's quartet when thinking about problems like this:
enter image description here

Obviously the association between the two variables is completely different in each plot, but each has exactly the same correlation coefficient.

If you know a priori what the possible non-linear relations could be, then you could fit a series of nonlinear models and compare the goodness of fit. But if you don't know what the possible non-linear relations could be, then I can't see how it can be done robustly without visually inspecting the data. Cubic splines could be one possibility but then it may not cope well with logarithmic, exponential and sinusoidal associations, and could be prone to overfitting. EDIT: After some further thought, another approach would be to fit a generalised additive model (GAM) which would provide good insight for many nonlinear associations, but probably not sinusoidal ones.

Truly, the best way to do what you want is visually. We can see instantly what the relations are in the plots above, but any programmatic approach such as regression is bound to have situations where it fails miserably.

So, my suggestion, if you really need to do this is to use a classifier based on the image of the bivariate plot.

  1. create a dataset using randomly generated data for one variable, from a randomly chosen distribution.

  2. Generate the other variable with a linear association (with random slope) and add some random noise. Then choose at random a nonlinear association and create a new set of values for the other variable. You may want to include purely random associations in this group.

  3. Create two bivariate plots, one linear the other nonlinear from the data simulated in 1) and 2). Normalise the data first.

  4. Repeat the above steps millions of times, or as many times as your time scale will allow

  5. Create a classifier, train, test and validate it, to classify linear vs nonlinear images.

  6. For your actual use case, if you have a different sample size to your simulated data then sample or re-sample to get obtain the same size. Normalise the data, create the image and apply the classifier to it.

I realise that this is probably not the kind of answer you want, but I cannot think of a robust way to do this with regression or other model-based approach.

EDIT: I hope no one is taking this too seriously. My point here is that, in a situation with bivariate data, we should always plot the data. Trying to do anything programatically, whether it is a GAM, cubic splines or a vast machine learning approach is basically allowing the analyst to not think, which is a very dangerous thing.

Please always plot your data.

Robert Long
  • 53,316
  • 10
  • 84
  • 148
  • 1
    "Even looking at...regression coefficients will not really help..."---that is not true. The standard errors of the regression coefficients would differentiate somewhat the four plots. Certainly the lower right corner plot would lead to a rejection of linear relationship according to any reasonable criterion. – Michael Sep 08 '20 at 08:41
  • 1
    @Michael but these are just examples. The bottom right plot could very conceivably be linear, with a true outlier due to some measurement mistake – Robert Long Sep 08 '20 at 09:05
  • @RobertLong, Im not really sure, whether you meant something like a computer vision kind of solution for detecting the relationship. – ShyamSundar R Sep 08 '20 at 09:09
  • Yes, that's exactly what I meant. – Robert Long Sep 08 '20 at 09:10
  • Ya. I thought of that long back. But Im not sure whether I ll get any ready made datasets for that. Or as this is a common use case which might be helpful for a lot of people, so maybe someone might come up with some pretrained model?? I mainly was looking for something like plug n play. – ShyamSundar R Sep 08 '20 at 09:11
  • 1
    Yeah I thought that would be what you wanted. I just think it's very difficult. It's a very interesting question though, and I'm still thinking about it. – Robert Long Sep 08 '20 at 09:48
  • 2
    @Michael also, linearity is an important *assumption* of linear regression. When you say *"lead to a rejection of linear relationship according to any reasonable criterion"* what criterion do you have in mind ? The t test in a linear reg of Y ~ X tests the null hypothesis that the regression coefficient is zero. It is not a test for linearity. You can easily have a non significant t test when the association is clearly linear, and a highly significant one when it is clearly nonlinear. Then there is the questsion of the significance level to choose, and all that. – Robert Long Sep 08 '20 at 09:54
  • @Robert Long Would this approach be any better than normalizing the data and extracting features on the difference between the 2 series and feeding that to a classifier (assuming we have a labeled dataset). – Tylerr Sep 08 '20 at 13:40
  • A test of non-linearity that doesn't require the simulation of a third dataset would be nice. After all, we already have the two predictors of interest and are only interested in their relationship, not some third predictor! – develarist Sep 08 '20 at 13:44
  • @Tylerr I would expect similar results. It would be interesting to find out!! – Robert Long Sep 08 '20 at 14:08
  • @develarist of course and those tests exist but they all fail to pick up on a lot of nuances and coding for all of those nuances would be hard which is why leveraging some ML to learn those might give you some advantages. Simulating these nuances and adding noise to create training data wouldn't be too bad. – Tylerr Sep 08 '20 at 14:47
  • but the nuances are already there. why simulate anything thats already there, and why would something artificial help with picking up something that already exists any better? – develarist Sep 08 '20 at 14:52
  • @develarist I take your point but what is your solution to the problem ? – Robert Long Sep 08 '20 at 15:11
  • 1
    @develarist I think a main issue is that a programmatic way of dealing with the nuances would most likely be some sequential decision making such as: Test for A, if A then deal with A THEN Test for B, if B then deal with B. But what if A and B are interacting TOGETHER? How would we know that maybe taking A out changes now how to deal with B? It gets really complicated to look at two series and really know what is happening, but we can simulate it and let the machine learn how to handle some of these things. Obviously it is still constrained to what nuances we know, but this is all feasible. – Tylerr Sep 08 '20 at 17:16
  • (-1) I don't know how to say this nicely, but this idea is nuts. Note that this is extremely complicated (why are we doing image recognition for bivariate analysis??) **and** doesn't do anything to help answer the original issue it stated to address of "looking for patterns outside a set of parameterizations we set in advance". – Cliff AB Sep 08 '20 at 23:31
  • 3
    @CliffAB this was never meant to be a serious solution. I was trying to point out the absurdity of not plotting the data, – Robert Long Sep 09 '20 at 07:45
  • 1
    @RobertLong, haha you got me then! I mean in the OP's defense, there are plenty of scenarios when there's just too many variables to look at all of them. (-1) removed. – Cliff AB Sep 09 '20 at 15:26
6

Linear/nonlinear should not be a binary decision. No magic threshold exists for informing the analyst things like "definitely linear". It's all a matter of degree. Instead, consider quantifying the degree of linearity. This can be measured relative to explained variation in Y by two competing models: one that forces linearity and one that doesn't. For the one that doesn't a good general-purpose approach is to fit a restricted cubic spline function (aka natural spline) with say 4 knots (the number of join points, here the number of points at which the 3rd derivative is allowed to be discontinuous) needs to be a function of the sample size and expectations about the possible complexity of the relationship.

Once you have both linear and flexible fits you can use either log-likelihood or $R^2$ to quantify explained variation in Y. As discussed in the RMS you can compute an "adequacy index" by taking the ratio of model likelihood ratio $\chi^2$ statistics (smaller model divided by larger model). The closer this is to 1.0 the more adequate is a linear fit. Or you can take the corresponding ratio of $R^2$ to compute relative explained variation. This is identical to computing the ratio of the variances of predicted values. More about relative explained variation is here.

When you do not know beforehand that something is linear, we use such quantifications to inform us about the nature of the relationship but not to change the model. If using standard frequentist models, to get accurate p-values and confidence bands one must account for all the opportunities the model was given to fit the data. That means using the spline model for estimates, tests, and confidence bands. So you could say "allow the model to be nonlinear if you do not know beforehand it is linear". And most relationships are nonlinear.

kjetil b halvorsen
  • 63,378
  • 26
  • 142
  • 467
Frank Harrell
  • 74,029
  • 5
  • 148
  • 322
  • do you have a working example of the cubic spline test, and how it, or other methods, separate out the degree of linearity and degree of non-linearity as quantities? – develarist Sep 08 '20 at 13:40
  • There are many examples in my RMS course notes at https://hbiostat.org/rms – Frank Harrell Sep 08 '20 at 19:00
5

The biggest problem you have here is that "non-linear relation" is not well defined. If you allow for any non-linear relation, there's basically no way to tell if something is "completely random" or just follows a non-linear relation that looks exactly like something that might come out of a "completely random" set up.

However, that doesn't mean you have no way to approach this problem, you just need to revise your question better. For example, you can use the standard Pearson's correlation to look for linear relations. If you want to look for monotonic relations, you can now try Spearman's Rho. If you want to look for potentially non-monotonic relations that still provide some ability to predict y given x, you can look at distance correlation. But note that as you get more flexible in what you call "correlated", you will have less power to detect such trends!

Cliff AB
  • 17,741
  • 1
  • 39
  • 84
1

It's relatively simple to measure linearity. To distinguish between non-linear relationship and no relationship at all, you're basically asking for a chi-squared test with a number of boxes equal to the number of possible values. For continuous variables, that means if you do a full resolution test, you'll have only one data point per box, which obviously (or I hope it's obvious) doesn't yield meaningful results. If you have a finite number of values, and the number of data points is sufficiently large compared to the number of values, you can do a chi-squared test. This will, however, ignore the order of the boxes. If you want to privilege possible relationships that take into account order, you'll need a more sophisticated method. One method would be to take several different partitions of the boxes and run the chi-squared test on all of them.

Getting back to the continuous case, you again have the option of taking a chi-squared of a bunch of different partitions. You can also look at candidate relationships such as polynomial and exponential. One method would be to do a nonlinear transformation and then test for linearity. Keep in mind that this can cause results that you may find non-intuitive, such as that x versus log(y) can give a p-value for linearity that's different from exp(x) versus y.

Another thing to keep in mind when doing multiple hypothesis tests is that the $\alpha$ you choose is how much probability mass you have to distribute among all false positives. To be rigorous, you should decide beforehand how much you're going to distribute among all the hypotheses. For instance, if your $\alpha$ is $0.05$ and you have five alternative hypotheses you are testing, you can decide beforehand that you'll reject the null only if one of the alternatives have $p < 0.01$.

Acccumulation
  • 3,688
  • 5
  • 11
  • is there a name for the method(s) you are describing, or link to their full procedure or implemented examples – develarist Sep 09 '20 at 02:07