I have a question concerning GLMs.
I carried out a test to see how far changing different variables during data processing changes the OOB error of a Random Forest model. Three variables were varied (range in parentheses) called SNR (3-20), HWS (5-30) and Baseline (5-30). The dependent variable is the RF OOB error that can range from 0 to 1 and actually ranges from 0.12 to 0.26.
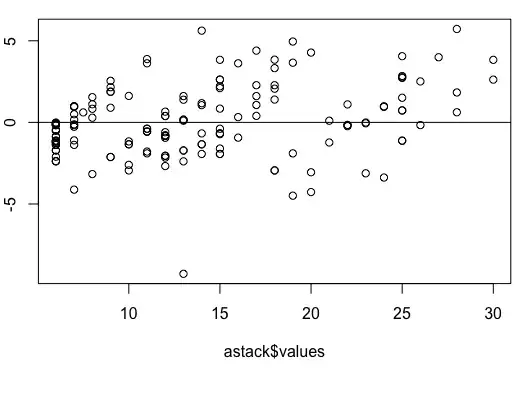
I wanted to carry out a GLM to see which independent variable influences the OOB error most. Here, I need to specify the distribution of the dependent variable. To do so, I used the command descdist in r (https://www.rdocumentation.org/packages/fitdistrplus/versions/1.1-1/topics/descdist) as was recommended here (How to determine which distribution fits my data best?). The resulting plot emphasizes that my data is beta distributed. I have read into GLMs a bit and found that GLMs cannot be done with beta distributed dependent variable. I have read that beta distribution can be neither 0 nor 1. In fact this would be possible with my dependent variable - but does this matter? Are the premises for a beta distribution violated by the potential of the dependent variable of being 0 or 1?
Another question: If my dependent variable is in fact beta distributed and GLMs cannot be built with it, what test can I carry out instead to find the most influential independent variable?
/edit: Here are some lines of data. In total it is more than 12.000 rows
Baseline iterations;Peak detection HWS;SNR;OOB-error
30;30;20;0.227060653
30;29;20;0.229393468
30;28;20;0.222395023
30;27;20;0.221617418
30;26;20;0.224727838
30;25;20;0.238724728
30;24;20;0.234059098
30;23;20;0.224727838
30;22;20;0.224727838
30;21;20;0.213063764
30;20;20;0.217729393
30;19;20;0.207620529
30;18;20;0.213063764
30;17;20;0.201399689
30;16;20;0.192846034
30;15;20;0.188180404
30;14;20;0.17962675
30;13;20;0.191290824
30;12;20;0.183514774
30;11;20;0.188958009
30;10;20;0.17962675
30;9;20;0.183514774
30;8;20;0.177293935
30;7;20;0.17651633
30;6;20;0.177293935
30;5;20;0.17651633
29;30;20;0.233281493
29;29;20;0.230171073
29;28;20;0.234836703
29;27;20;0.217729393
29;26;20;0.223950233
29;25;20;0.230171073
29;24;20;0.230948678
29;23;20;0.230948678
29;22;20;0.220839813
29;21;20;0.212286159
29;20;20;0.209953344
29;19;20;0.211508554
29;18;20;0.202177294
29;17;20;0.198289269
29;16;20;0.200622084
29;15;20;0.199066874
29;14;20;0.188958009
29;13;20;0.183514774
29;12;20;0.192068429
29;11;20;0.193623639
29;10;20;0.171073095
29;9;20;0.17962675
29;8;20;0.171073095
29;7;20;0.18118196
29;6;20;0.171073095
29;5;20;0.180404355
28;30;20;0.227060653
28;29;20;0.223950233
28;28;20;0.223950233
28;27;20;0.223950233
28;26;20;0.227838258
28;25;20;0.225505443
28;24;20;0.232503888
28;23;20;0.220062208
28;22;20;0.221617418
28;21;20;0.216951788
28;20;20;0.216174184
28;19;20;0.220062208
28;18;20;0.209953344
28;17;20;0.209953344
28;16;20;0.196734059
28;15;20;0.192846034
28;14;20;0.200622084
28;13;20;0.184292379
28;12;20;0.191290824
28;11;20;0.193623639
28;10;20;0.190513219
28;9;20;0.181959565
28;8;20;0.180404355
28;7;20;0.186625194
28;6;20;0.178849145
28;5;20;0.175738725
27;30;20;0.230948678
27;29;20;0.223950233
27;28;20;0.225505443
27;27;20;0.222395023
27;26;20;0.222395023
27;25;20;0.226283048
27;24;20;0.228615863
27;23;20;0.227838258
27;22;20;0.223172628
27;21;20;0.212286159
27;20;20;0.216174184
27;19;20;0.202177294
27;18;20;0.199844479
27;17;20;0.210730949
27;16;20;0.201399689
27;15;20;0.200622084
27;14;20;0.190513219
27;13;20;0.195178849
27;12;20;0.193623639
27;11;20;0.192068429
27;10;20;0.188180404
27;9;20;0.17962675
27;8;20;0.175738725
27;7;20;0.185069984
27;6;20;0.178849145
27;5;20;0.17496112
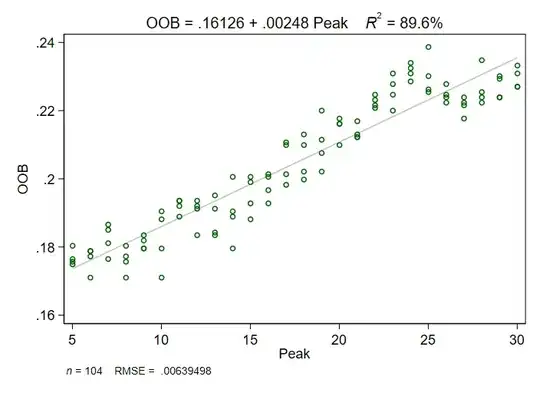
/edit2: I added an image showing the relation of the indpendent variables to the DV 

