Introduction: Lets say we have a random variable $X$ that follows a normal distribution, $X \sim N(\mu, \sigma^2)$ , with a CDF function $F_X(x) = P(X \leq x)$. Then we draw some random samples $S_1$, $S_2$,... , $S_n$ from $X$ . If we then evaluate $U_i = F_X(S_i)$ for each $S_i$, then $U_1$, $U_2$,... , $U_n$ will follow an uniform distribution. See Why is the CDF of a sample uniformly distributed for more details.
Question: How is $U$ distributed if $S_i$ are not drawn from an univariate normal, but instead from a multivariate normal $X \sim N(\mu, \Sigma)$, with CDF function $F_X(x) = P(X_j \leq x_j \forall j)$ where $x = (x_1, x_2, ..., x_n)$?
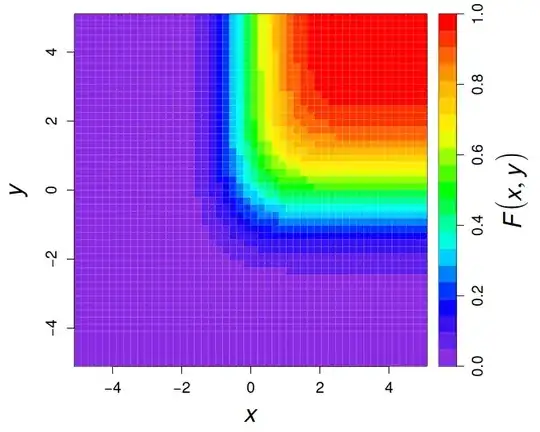
Clearly $U$ is no longer distributed uniformly; E.g. if $X$ is bivariate normal with $\mu_1 = \mu_2 = 0$ and correlation = 0.6/2**0.5, we get follwing cdf:
(image from http://users.stat.umn.edu/~helwig/notes/norm-Notes.pdf , slide 21)
In this example we can clearly see that low probabilities are much more common than high ones (larger area). This can also be shown by extending the python code from the question linked previously ( Why is the CDF of a sample uniformly distributed ) to the multivariate case, now with a standard bivariate normal (mean=0, variance = 1, covariace = 0):
import matplotlib.pyplot as plt
import scipy.stats

mu = [0,0]
covar = [[1,0], [0,1]]
xs = scipy.stats.multivariate_normal.rvs(mu, covar, 10000)

fig, axes = plt.subplots(1, 2, figsize=(9, 3))
axes[0].hist(xs, bins=50)
axes[0].set_title("Samples")
axes[1].hist(
    scipy.stats.multivariate_normal.cdf(xs, mu, covar),
    bins=50
)
axes[1].set_title("CDF(samples)")
plt.show()

