I am fairly new to this and it has been more than a decade since I touched statistics at university, so please bear with me.
I am following an introductory book to machine learning and it has been so far a blast, really enjoying this and generally I can carry on or search my way through the math I have not touched in a decade. However while reading the author's solution to an exercise, I see he stated the following:
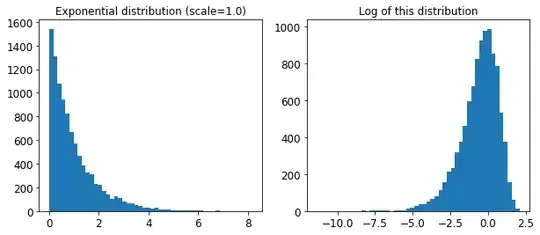
Let's look at the exponential distribution we used, with
scale=1.0. Note that some samples are much larger or smaller than 1.0, but when you look at the log of the distribution, you can see that most values are actually concentrated roughly in the range of exp(-2) to exp(+2), which is about 0.1 to 7.4.
And then shows the following graphs:
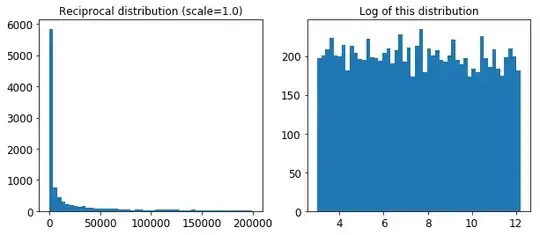
Furthermore, later the author also states (About the reciprocal distribution now):
The distribution we used for
Clooks quite different: the scale of the samples is picked from a uniform distribution within a given range, which is why the right graph, which represents the log of the samples, looks roughly constant. This distribution is useful when you don't have a clue of what the target scale is:
And then this:
I know that log is the inverse of exp function, but I cannot see the "value" of showing this or which information the author is obtaining from this. This makes me feel confused, then angry and soon I may turn green and incredible, as I could not find any clear answer why this is done here. Even any textbook reference I should read to refresh these concepts (In case it is something extremely basic I am ignoring) would be greatly appreciated.

