1

Is it possible to determine if distribution of time-series has shifted significantly without assuming any particular underlying data distribution?

Furthermore, would it be possible to identify point of split between (possibly two) distributions?

Any links to softwares or pointers to references would be greatly appreciated.

Nick Cox
  • 48,377
  • 8
  • 110
  • 156
jitendra
  • 468
  • 2
  • 6
  • 12
  • 2
    THis question is very similar to http://stats.stackexchange.com/questions/48107/tools-to-detect-jumps-in-a-linear-time-series/48146#48146 . My response should be of help to you, not only technically but with respect to available software. – IrishStat Jan 22 '13 at 21:56
  • Thanks a lot. I will go through the softwares and paper you suggest :-) – jitendra Jan 22 '13 at 22:20

2 Answers2

1

I used the data in http://pymc-devs.github.com/pymc/tutorial.html#an-example-statistical-model . It has 111 years of data . An appropriate model detects a Level Shift at 1887 . A level shift is one kind of "structural change" enter image description here 
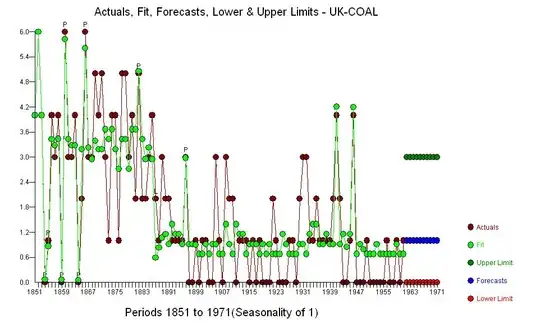
The equation says it all. enter image description here 
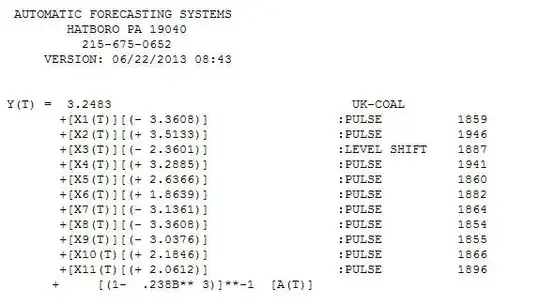
. The residuals do not appear to have any overt Gaussian Violations enter image description here 
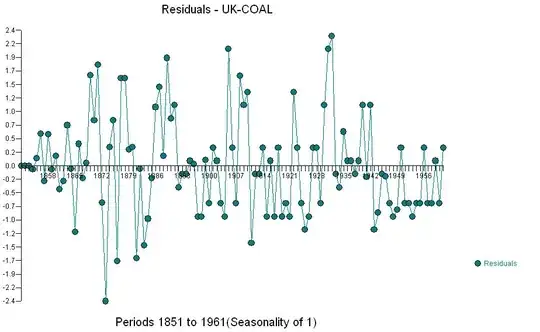
. The method used was ARIMA plus Intervention Detection . I used AUTOBOX from http://www.autobox.com, a piece of software that I have helped develop. Similar results might be obtainable from other sources.

IrishStat
  • 27,906
  • 5
  • 29
  • 55
0

There is actually a quite detailed description of how to analyze a similar problem with PyMC, i.e. a jump in coal mining disasters. Note that this particular time series has been modelled as a Poisson distribution. Yours might be different.

user12719
  • 1,009
  • 1
  • 8
  • 10