I have an imbalanced dataset, with the following stats:
  Value    Count   Percent
      0    133412     97.62%
      1     3247      2.38%
I have created a classifier (boosting ensemble classifier together the RUSBoost algorithm, with 300 learning cycles and a learn rate of 0.1; using weak learners as decision trees with a maximum of 1300 splits) using 50% holdout cross-validation [1]
By applying the resulting classifier to the test dataset (and comparing the resulting classification with the real classes), I get the following results: 2
Sensitivity: 86.7%
Specificity: 99.8%
NPV: 99.9%
PPV: 86.4%
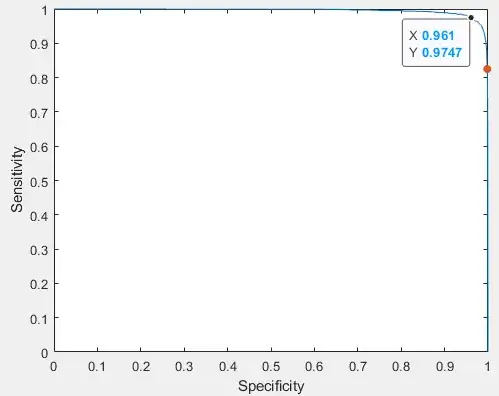
Overall, in my test dataset I get the following ROC curve (modified) [3]:

The red-point indicates the classifier overall results (described previously). I now want to balance those result and make my model more sensitive (e.g., 85% specificity and 99% sensitivity). I have tried changing the prior probabilities and the costs during training, but it doesn't affect my test results. I'm now trying to use the prediction scores to achieve the higher sensitivity. Hence, my question is:
How can I adjust my scores so that my classifier performs with higher sensitivity (and lower specificity)? And, in terms of cross-validation, where should that adjustment be made? Recommendations are appreciated! I'm also confused whether that adjustment should be done in the testing or training set.
Many thanks, DT
Source code in MATLAB:
[1]
% Create template tree
template_tree = templateTree('MergeLeaves', 'off', 'MaxNumSplits', 1300, ...
    'NumVariablesToSample', 'all', 'Prune', 'off');

% Create Ensemble model
esemble_model = fitcensemble(holdout_train_features, holdout_train_classes, ...
    'Method','RUSBoost', 'NumLearningCycles', 300, ...
    'Learners', template_tree, 'LearnRate', 0.1);
%% Perform validation on test dataset
% Apply model to test dataset
[obtained_classes, scores] = predict(esemble_model, holdout_test_features);

% Compare obtained classes with the real classes using the confusion matrix
holdout_validation_results = confusionchart(holdout_test_classes, obtained_classes);
TN = holdout_validation_results.NormalizedValues(1,1);
TP = holdout_validation_results.NormalizedValues(2,2);
FP = holdout_validation_results.NormalizedValues(1,2);
FN = holdout_validation_results.NormalizedValues(2,1);
accuracy = (TP + TN)/(TP + TN + FP + FN);
sensitivity = TP/(TP + FN);
specificity = TN/(TN + FP);
PPV = TP/(TP + FP);
NPV = TN/(TN + FN);
At this stage, I honestly don't know how MATLAB uses the classifier / scores to get the prediction classes. I do know that the ensemble fitting function has a score transform input.
[3]
% Compute the ROC curve using the prediction scores
[X, Y, T, AUC, OPTROCPT] = perfcurve(holdout_test_classes,score(:,2), 1);
plot(1-X,Y)
hold on
xlabel('Specificity')
ylabel('Sensitivity')