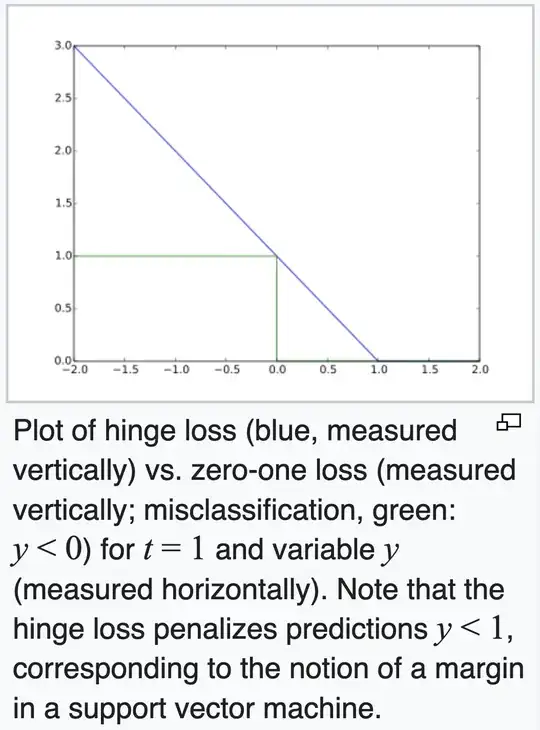
I have seen the plot below in many textbooks before. What do the X axis and the Y axis represent exactly? What does it mean for the Hinge loss to "touch" the 0-1 loss on the (x,y) pair (0,1)?
If helpful, the source of this picture is from the entry on Hinge Loss on Wikipedia.