0

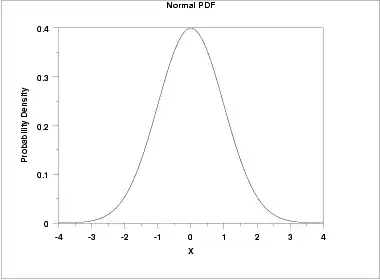
I have this example of a probability density function that is centered around 0. I would like to find out what are the lower and the upper limit of 95% of the data that is around 0. The goal is to find out what are the confidence limits that 95% of the data is between this interval.

So instead of using CDF to find out what is the x value that tells me the limit of 95% of the data, I want to find out the lower and the upper limit centered around 0 that takes 95% of the data. Eg., let's imagine that between the interval [-1, 1], you have 95% of the data. How can I find this?
xeon123
  • 225
  • 2
  • 6
  • 2
    See the first three illustrations in my post at https://stats.stackexchange.com/a/130772/919. – whuber Jul 29 '20 at 15:26
  • 3
    An interval that contains 95% of the probability mass is not uniquely defined. You can use the 2.5% and 97.5% quantiles, or the 1% and 96% quantiles, or a [Highest Density Region](https://stats.stackexchange.com/q/148439/1352). How you get these will depend on your software. – Stephan Kolassa Jul 29 '20 at 15:29
  • Do you know that you have symmetry about $0$? – Dave Jul 29 '20 at 15:33
  • To find the upper and lower limits of a PDF, I will either scroll or use the `home` and `end` buttons. – abalter Jul 29 '20 at 17:09

0 Answers0