12

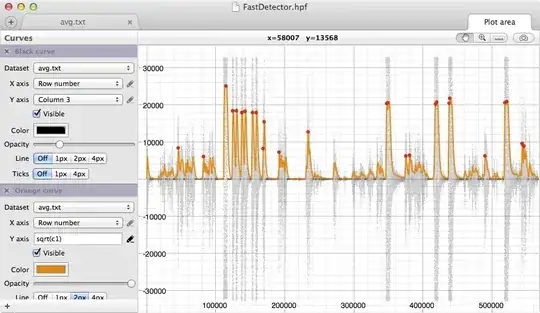
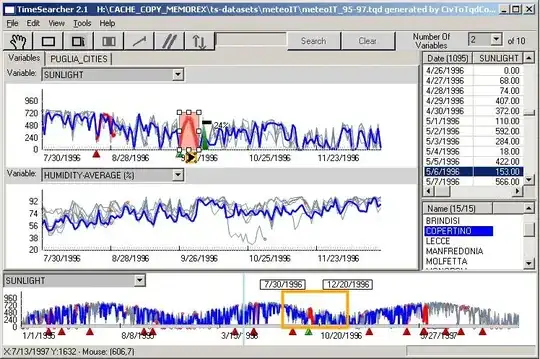
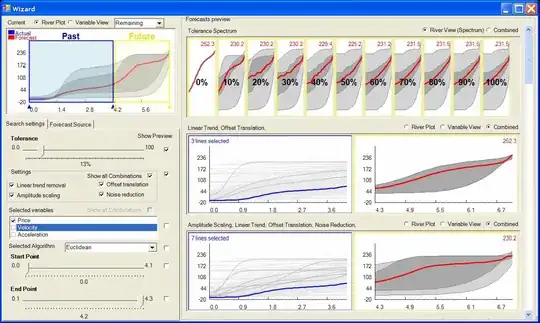
I often deal with reasonable sized amount of time series data, 50-200 million doubles with associated time stamps and would like to visualize them dynamically.

Is there existing software to do this effectively? How about libraries and data formats? Zoom-cache is one example of library focusing on large time series. In Zoom-cache the data is summarized at several resolutions to make it easier to view at different resolutions.

Edit: Also if there is anywhere else I should ask this question or seek an answer please let me know.

Davorak
  • 191
  • 1
  • 6
  • 1
    Although I have no idea about how it will scale with such huge number of data points, you might want to take a look at [Cubism.js](http://square.github.com/cubism/). – chl Jan 17 '13 at 09:27
  • I took a look at Cubism, which looks good for incremental updating graphs from serial streams of data, but with my short search I did not see anything about caching multiple resolutions or summary data to speed up large data sets. Thats for the pointer though it looks like a cool library. – Davorak Jan 17 '13 at 23:39
  • 1
    You might be interested in Zoomdata https://www.zoomdata.com/product/fast-data-sharpening-visualization/ Their pricing is quite high though. – chhantyal Feb 20 '17 at 22:33
  • @chhantyal - Thanks! That does look like the kind of tool I was looking for. Though I am no longer working with the same data sets I am still interested in the space so I will probably try out zoomdata's trail at some point. – Davorak Feb 22 '17 at 04:15

3 Answers3

3

Sorry for self-ad, but Thunderplot (thunderplot.com) would be good candidate for it. I wrote it exactly for interactive plotting of large datasets. I didn't test it with 200KK rows datasets, but it works fine with ~10KK rows. Also there's "read every Nth row" feature, so you can reduce amount of data to store/visualize. I can send you the registration key in exchange to one of those large datasets. :-)

thunderplot screenshot

2

There are a set of research tools called TimeSearcher 1--3 that provide some examples of how to deal with large time-series datasets. Below are some example images from TimeSearcher 2 and 3.

TimeSearcher 2

TimeSearcher 3

edallme
  • 306
  • 1
  • 3
1

Another self-promoting post because I work for this company, but SensorCloud (sensorcloud.com) uses smart algorithms to graph massive datasets very quickly. It was originally designed with our physical sensors in mind, but it has a CSV uploader to handle any timeseries data.

For example, we uploaded a dataset that had 100 billion data points (over 1 terabyte of timestamp + data values) and you can graph it and interact with it very quickly.

Here's a public link to that dataset: https://sensorcloud.microstrain.com/SensorCloud/data/Z3MFURATHIB8A032/

The link above uses our flash viewer. If you don't want to use flash, here's the javascript viewer: https://sensorcloud.microstrain.com/SensorCloud/data/Z3MFURATHIB8A032/js/

Use the scroll wheel, or Shift+left click to zoom in.