You are right in suspecting that your professor misunderstood.
The correct answer is that we cannot say anything whatsoever about the percentage improvement in student achievement driven by teacher expertise. Nothing at all.
Why is this so? The quote is in terms of variance explained. Variance explained has nothing to do with the actual values on which the scales are measured - which any percentage improvement in student achievement would be accounted in. The two are completely separate.
Let's look at an example. Here is some simulated data:
R code:
nn <- 1e2
set.seed(1) # for reproducibility

teaching_expertise <- runif(nn)
student_achievement <- 5+0.1*teaching_expertise+rnorm(nn,0,0.05)
model <- lm(student_achievement~teaching_expertise)

plot(teaching_expertise,student_achievement,pch=19,las=1,
    xlab="Teaching Expertise",ylab="Student Achievement")
abline(model,col="red")
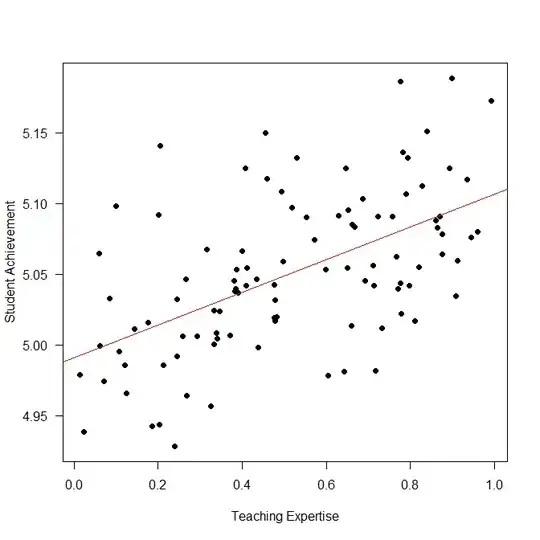
Note that the model is correctly specified: student achievement depends linearly on teaching expertise, and that is what I am modeling. No cheap tricks here.
We have $R^2=0.30$, so teaching expertise indeed accounts for 30% of student achievement (see here):
> summary(model)

Call:
lm(formula = student_achievement ~ teaching_expertise)
... snip ...
Multiple R-squared:  0.304,     Adjusted R-squared:  0.2969
However, here is the student achievement we would predict for teachers at the very bottom (teaching expertise of 0) vs. at the very top of the range (1):
> (foo <- predict(model,newdata=data.frame(teaching_expertise=c(0,1))))
       1        2
4.991034 5.106651
The improvement is on the order of $\frac{5.11-4.99}{4.99}\approx 2.4\%$.
> diff(foo)/foo[1]
         2
0.02316497
(Plus, this is expected achievement. Actual achievement will be different. With regression to the mean typically being stronger at the extremes, the actual difference will be even smaller.)
And you know what? We could change this percentage change to pretty much any number we want. Even a negative percentage improvement! How? Simply by changing that single innocuous number 5 in the data simulation above, i.e., the intercept.
What's going on? Variance explained measures the amount by which the (sum of squared) residuals are reduced by a model, i.e., the difference between the residuals to the regression line and the residuals to the overall average. By changing the intercept (the 5), we can shift everything up and down. Including the overall average. So changing the intercept will leave variance explained completely unchanged. (If you have R, try this. We'll wait.)
However, shifting everything up and down will change the concrete scores. In particular the percentage improvement of a "good" vs. a "bad" teacher. If we shift everything down far enough, we get a negative student achievement for the "bad" teacher. And a positive change for the "good" teacher against a negative baseline will give you a negative percentage improvement. (Again, try this. An intercept of -1 works.)
Yes, of course such negative percentage improvements make no sense here. This is just an illustration of the fact that there is zero relationship between variance explained and percentage improvement in measurements.
